Code review economics
Splitting a pull request costs waiting. Here's how much.
On this page · 9 sections
- A smaller diff still has to reach the reviewer
- What the timestamps actually measure
- Three repositories, three shallow slopes
- One change, three ways to wait
- What that means for your 800 lines
- What small PRs buy
- Change the pickup, not just the line limit
- What I’d check before using the numbers
- Run it on the snapshot or your own repository
You’ve just finished an 800-line feature. It works, the tests pass, but your team’s policy is pull requests under 200 lines. Four PRs would meet the policy. Eight would be even smaller.
But each PR needs someone to start reviewing it. If the pieces enter the queue one after another, a smaller diff can mean more waiting before the feature is done.
To put a price on that, I’ll use real review histories: 2,187 merged pull requests from three busy open-source projects, astral-sh/ruff, grafana/grafana and pola-rs/polars. The data is committed with the companion code, so you can check every number. With them we can price each way of reviewing your pieces, and see how much the price depends on what we assume. As it turns out, how small to make each piece matters less than who reviews the pieces, and whether they pick them up together.
The short version
- The wait for a first review grows much more slowly than a PR’s size on these three repositories. Double a PR and its wait goes up by 13% to 35%, not 100%.
- That’s a weak correlation. Size explains between 1% and 7% of how long a PR waits. So every price below comes as a range, from “size drives the wait as the measured trend says” to “size has no effect at all”.
- Eight PRs reviewed one after another wait 3.3 to 8 times as long in total as one PR.
- Eight PRs opened side by side still wait for the slowest of eight first reviews: 2.1 to 5.1 times one PR’s wait.
- One reviewer taking all eight in one sitting waits 0.41 to 1 times one PR’s wait. That is never worse than one PR, but it rests on an assumption about how the reviewer works, not on a measurement.
- Small PRs do get more discussion per line: 3.0 to 4.6 times as many review threads per line as large ones. Thread counts don’t say how many bugs review caught.
A smaller diff still has to reach the reviewer
Think of review as a ferry crossing. A car waits for the crossing, not for the cars ahead of it to be inspected one by one. The ferry leaves when it leaves, and a ferry with one car on it takes about as long as a ferry with eight.
So your eight pieces can go three ways. Eight cars can cross one at a time, each waiting for a new departure. They can take eight different ferries at once, and the convoy isn’t across until the last ferry lands. Or they can all board one ferry together, and wait for one crossing.
Those are three ways of reviewing a split change: one after another, side by side, or one reviewer taking all of them in one sitting. The amount of code is the same in all three. The number and arrangement of waits are not. The ferry has a deckhand too, and with fewer cars on board, each car gets a closer look. We’ll come back to him.
“Keep PRs small” is advice I’ve given and still give. What I’ve learned to ask alongside it is what the team’s reviewers do with a small PR when it lands. If it waits until the reviewer’s next free slot, cutting it smaller hasn’t created another slot. The mistake I see most often is treating “small PRs” as the goal rather than as one lever among several, and pulling it without looking at what it costs in waiting.
What the timestamps actually measure
I’ll measure one thing: the pickup wait, the time from when a PR is ready for review to the first review submitted by someone other than its author. It’s mostly the part of a PR’s life when nobody is working on it. It’s also a proxy: GitHub records when a review is submitted, not when someone first opened the diff, so the wait can include time spent reading before submitting.
The demo, fetch_prs.py, uses the GitHub CLI to fetch each repository’s 1,000 most recently created merged PRs, with all of their reviews. split_cost.py then keeps the PRs that a person wrote and someone else reviewed, and measures each one:
ready = ts(ready_events[0]["createdAt"]) if ready_events else ts(p["createdAt"])reviews = [ r for r in p["reviews"]["nodes"] if r["submittedAt"] and not is_bot(r["author"]) and r["author"]["login"] != p["author"]["login"]]A PR opened as a draft becomes ready when its author says so. fetch_prs.py asks GitHub for only the last “ready for review” event, so ready_events[0] is that event, and the clock starts there. A PR that was never a draft starts at its creation. The first review by anyone except the author and bots stops the clock.
Later review rounds, CI, merging and rebasing are outside the metric, because they depend on what the change is far more than on how it’s cut. So are PRs that hadn’t merged when the data was fetched. This describes the merged PRs that were kept, not everything that entered those projects’ queues.
Why would the pickup wait depend so little on size? Reviewers have their own tasks, meetings and time zones. A reviewer looks at the queue between their own work, and when they get to it has more to do with their day than with whether the PR is 100 lines or 800. Google’s engineering practices say it plainly: “One business day is the maximum time it should take to respond to a code review request (i.e., first thing the next morning)” (Speed of Code Reviews). That’s a rule about when a reviewer comes back to the queue. It says nothing about size.
Three repositories, three shallow slopes
After filtering, there are 708 PRs from ruff, 857 from grafana and 622 from polars. Here’s grafana by size:
== grafana/grafana: 857 of 1000 merged PRs by people, with a review by someone else, created 2026-09-17 to 2026-10-10left out: 140 written by bots; 3 by people with no review by anyone else, median 46 lines against 131 for those kept lines PRs median pickup review threads per 100 lines 1-10 105 0.20 h 7.35 11-50 158 2.37 h 1.05 51-200 260 1.06 h 0.79 201-500 165 2.00 h 0.57 501-2000 144 2.96 h 0.35 2001+ 25 1.10 h 0.09 ...The medians don’t climb neatly. The 11 to 50 line bin waits longer than the next one, and the largest bin waits less than either. A median per size bin is a noisy number. The smallest bin, 1 to 10 lines, is mostly one-line fixes that get waved through: grafana’s waited a median of twelve minutes.
Compare 11 to 50 lines with 501 to 2,000, a PR tens of times larger. Grafana goes from 2.37 to 2.96 hours. Polars goes from 15.06 to 16.92. Ruff rises more sharply, from 0.86 to 13.03 hours, and has the steepest fit of the three.
To use every PR rather than six medians, the script fits a straight line to against . On log scales, “doubling the size multiplies the wait by a fixed amount” is a straight line, and its slope is that amount’s exponent: the elasticity, e. Double a PR’s size and its wait is multiplied by . If the wait grew in proportion to size, would be 1. If size didn’t matter at all, it would be 0.
The script prints one fit line per repository. Grafana’s reads:
...fit: e = 0.25 (95% bootstrap 0.17 to 0.34), r = 0.19, n = 857; doubling a PR multiplies its expected wait by 1.19 without the 96 PRs reviewed within 3 minutes of being ready: e = 0.16, n = 761 ...On grafana, a PR twice the size waits about 19% longer on the fit. Leaving out the near-instant reviews, explained in the first <details> below, lowers e to 0.16. The bootstrap range comes from refitting on 1,000 resamples of each repository’s PRs, and says how much e would move with a different sample from the same project. r is the correlation between log size and log wait, which I’ll come back to after the figure. All three repositories side by side:
| Repository | e | 95% bootstrap | r | PRs | Doubling a PR multiplies its wait by |
|---|---|---|---|---|---|
| astral-sh/ruff | 0.43 | 0.31 to 0.55 | 0.27 | 708 | 1.35 |
| grafana/grafana | 0.25 | 0.17 to 0.34 | 0.19 | 857 | 1.19 |
| pola-rs/polars | 0.18 | 0.06 to 0.29 | 0.12 | 622 | 1.13 |
From each repository’s fit: line.
The bootstrap range doesn’t cover the choices made in extracting the data, and it doesn’t show that changing a PR’s size would change its wait. All three ranges sit well below 1.
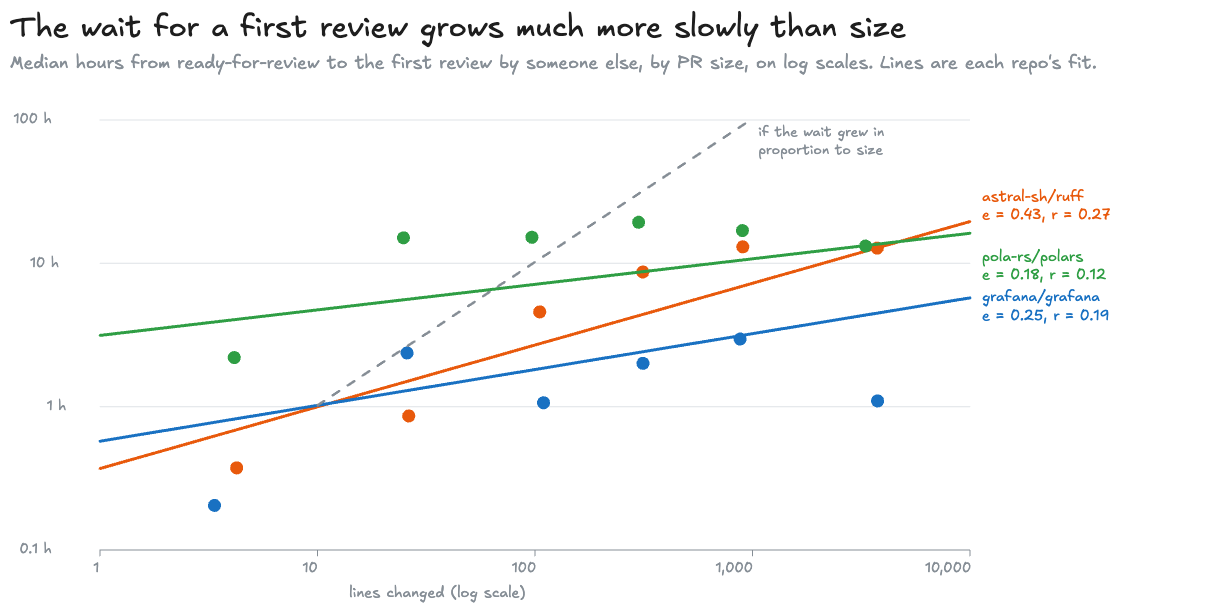
An r of 1 would put every PR on the line, 0 would mean no relationship at all. Here it’s 0.27 at best. Squared, it’s the share of the variation in log wait that size accounts for: 7% on ruff, 3.5% on grafana, 1.5% on polars. Size leaves most of the wait unexplained. The data doesn’t say how the rest divides between who’s around, how urgent the PR is, who wrote it and what else is in the queue.
So this describes these PRs as a group, and it’s a correlation, not a cause. A small PR might be a maintainer’s urgent fix, and a large one a newcomer’s feature. It may be picked up fast because of who wrote it and what it is, not because it’s small. Nothing here says that cutting your PR in half would change how long either half waits.
The three-minute floor, and who's left out
A log needs a positive wait, so a PR reviewed within 3 minutes of being ready counts as 3 minutes. Most of these were drafts, and about half of them were reviewed before the author marked them ready. They move e more than the bootstrap range suggests: leaving them out takes ruff from 0.43 to 0.48, grafana from 0.25 to 0.16, and polars from 0.18 to 0.20.
Left out altogether:
| Repository | Written by bots | Written by people, reviewed by nobody else | Median size of those, against those kept |
|---|---|---|---|
| astral-sh/ruff | 122 | 170 | 44 lines against 158 |
| grafana/grafana | 140 | 3 | 46 lines against 131 |
| pola-rs/polars | 2 | 376 | 110 lines against 62 |
On ruff the unreviewed PRs are mostly small, so ruff’s small end is the part of its curve with the most missing. On polars it’s the other way round. These filters change which part of the size range the fit sees.
One change, three ways to wait
Split a change into PRs of equal size. I’ll price each way of reviewing them twice. In the first, size drives the wait the way the fit says, and the scatter around the line stays as it is. In the second, size has no effect, and each piece waits like an ordinary PR. These two ends aren’t confidence bounds, and a real workflow could fall outside them, for example if a stack of PRs looks unusually daunting or gets special attention. What they show is the cost of paying for several pickups.
Every price is a multiple of one PR’s expected wait: the average pickup over many PRs of that size, not the wait of any one PR. A multiple of 2 means the split change waits twice as long, on average, as the same lines in one PR. Here are the three ways at a glance, priced for your 800 lines cut into four 200-line PRs, the policy’s size, on grafana’s queue:
| Way | What the change waits for | What the model assumes | 4 PRs of 200 lines on grafana |
|---|---|---|---|
| One after another | 4 pickups in a row | Each piece is opened only when the one before has merged, so the waits add up | x2.83 to x4 |
| Side by side | The slowest of 4 pickups | The 4 pickups are independent: how long one waits says nothing about the others | x2.26 to x3.17 |
| In one sitting | 1 pickup | One reviewer starts all 4 as soon as they’d start one small piece | x0.71 to x1 |
The first number is as the fit says, the second as if size had no effect. From the k = 4 row of the demo’s grafana output, quoted in full in the next section.
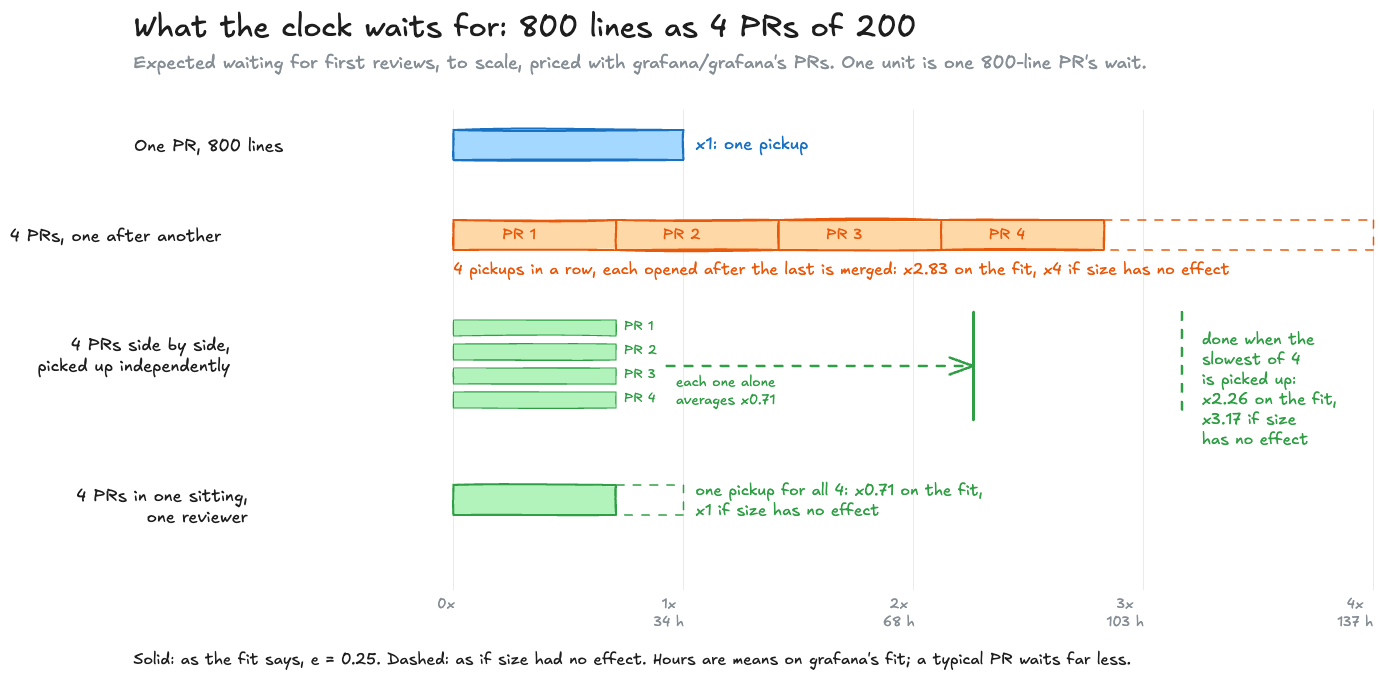
One after another. Each piece waits for its own pickup, and the next isn’t opened until the last is merged. If size drives the wait, each piece waits as long as the whole change would. Expected waits add, so the total is pieces times each, which comes to times one PR’s wait.
That holds on average if the fit is right, however scattered the waits are around it. For your 8 pieces on grafana, with , that is : eight shorter waits in a row, nearly five times the one long one. If size had no effect, it would be eight ordinary waits, a multiple of 8.
Side by side. All eight open at once, each picked up whenever its reviewer gets to it. Now the change waits for the slowest of eight pickups, and the slowest of eight depends on how scattered the waits are, not just on . It’s the fan-out problem from the latency post: a checkout page that waits for 20 calls is as slow as its slowest, and so is a feature that waits for 8 reviews.
The demo works it out from each repository’s own scatter. A residual is how many times longer or shorter a PR waited than the line predicts for its size: 2 for a PR that waited twice the prediction, 0.5 for half. This function gives the expected largest of residuals drawn at random, relative to the mean of one:
def slowest_of(k: int, values: list[float]) -> float: """Expected largest of k independent draws from `values`, over their mean. Exact, not sampled.
The largest of k draws is the i-th smallest value with probability (i/n)^k - ((i-1)/n)^k, so the expectation is a weighted sum over the sorted values. No randomness, so the answer can't depend on what else was computed first. """ s = sorted(values) n = len(s) return sum(x * ((i / n) ** k - ((i - 1) / n) ** k) for i, x in enumerate(s, 1)) / st.mean(s)is the chance that all draws are at or below the i-th smallest value. Subtracting the chance that they’re all below it leaves the chance that the largest is exactly that value. Weighting each value by that chance gives the expected largest, and dividing by the mean turns it into “times the expected single pickup”. The sum is exact for these residuals. Treating the draws as independent is still an assumption.
It’s tempting to say each piece waits , so side by side the change waits , under 1. That would be true if every PR waited exactly what the line predicts. The scatter in these waits is wide: a PR can wait ten minutes or a week. Eight independent pickups almost always include a slow one, and the slowest dominates. If size had no effect, it’s the slowest of eight ordinary pickups, worked out the same way from the waits themselves.
One author’s eight PRs, opened together, are rarely independent. They share a day, a reviewer pool and a weekend. Delays that tend to come together make the slowest of eight smaller than independent draws would, but contention for the same reviewers can push the other way. So the independent calculation is a baseline to compare against, not a guaranteed upper bound. The latency post says the same about correlated calls.
In one sitting. One reviewer takes all eight together. The assumption here is the generous one: that the reviewer starts the stack as soon as they’d start one of its small pieces. The change then waits for one pickup of a PR eight times smaller, of one PR’s wait. The data doesn’t measure this. If what makes a reviewer put a PR off is the work they can see, an 800-line stack (the eight PRs, taken as one chain) looks like an 800-line PR, and the wait is one ordinary pickup, a multiple of 1. That is the ferry with all eight cars on it. Either way, it’s no worse than one PR, because the pickup happens once.
Here is the whole calculation worked through for your four 200-line pieces on grafana, where . One 800-line PR’s expected pickup on grafana’s fit is 34.2 hours, so the hours row is each multiple times 34.2:
| Step | One after another | Side by side | In one sitting |
|---|---|---|---|
| One piece’s expected pickup, | 0.71 | 0.71 | 0.71 |
| Pickups the change waits for | 4, in a row | The slowest of 4 | 1 |
| The multiple, as the fit says | 0.71 | ||
| In hours, on grafana’s mean | 96.7 h | 77.3 h | 24.2 h |
| The multiple, if size has no effect | 3.17 | 1 |
3.20 is slowest_of(4, residuals) on grafana: the slowest of four independent pickups averages 3.20 times a single one. The products use the unrounded 0.707.
The hours are means, and a mean pickup on these repositories sits far above a typical one, as the <details> in the next section shows. They are there to make the multiples concrete, not as a forecast for your PRs.
What that means for your 800 lines
The demo prints all three ways for each repository, at both ends. For grafana:
...split into k PRs, expected waiting against one PR's, if size drives the pickup as the fit says | if size has no effect: k one after another side by side in one sitting | after side sitting 2 x1.68 (1.58 to 1.78) x1.54 x0.84 | x2 x1.83 x1.00 4 x2.83 (2.50 to 3.17) x2.26 x0.71 | x4 x3.17 x1.00 8 x4.76 (3.96 to 5.65) x3.10 x0.59 | x8 x5.12 x1.00 ...The left half is the fit’s end, the right half the no-effect end. The range beside one after another is the bootstrap range of e carried through, so it covers the sampling uncertainty in e and none of the workflow assumptions. Across the three repositories, eight pieces cost:
| Repository | One after another | Side by side | In one sitting |
|---|---|---|---|
| astral-sh/ruff (e = 0.43) | x3.27 to x8 | x2.08 to x4.89 | x0.41 to x1 |
| grafana/grafana (e = 0.25) | x4.76 to x8 | x3.10 to x5.12 | x0.59 to x1 |
| pola-rs/polars (e = 0.18) | x5.52 to x8 | x3.32 to x4.66 | x0.69 to x1 |
The first number in each cell is as the fit says; the second, as if size had no effect. These are model outputs, not experiments that split the same feature.
So, priced with grafana’s queue, your eight PRs one after another wait 4.76 to 8 times as long as one PR would. Side by side, they wait 3.10 to 5.12 times as long. In one sitting with one reviewer, 0.59 to 1 times. Four pieces of 200 lines, inside the guideline, cost 2.83 to 4, 2.26 to 3.17, and 0.71 to 1. The guideline is met in all three cases, and the waits are very different. A line limit doesn’t tell you which of those the team intends.
Why means, when review waits are so uneven
The multiples are of expected (mean) waits, because waits that follow one another add, and means add. Medians don’t: the median of a sum of waits isn’t the sum of their medians. These waits are very uneven. Most PRs are picked up within a few hours, and a few wait for weeks, which pulls the mean far above the median. On grafana’s fit, one 800-line PR has a median pickup of 2.1 hours and a mean of 34.2.
The script also prints the comparison on medians:
...on medians instead of means, k = 8: one after another x53.21, side by side x31.93, in one sitting x0.59Against a much smaller baseline, the multiples for the first two ways are much larger, and the order of the three ways is the same. Ruff and polars come out in the same order. Don’t mix these with the table above.
The multiples don’t depend on the size of the change at all, only on e and the scatter, which is why I quote them rather than hours. That follows from fitting one straight line and reusing its scatter at every size. It isn’t a claim that an 80-line fix and an 8,000-line redesign go through the same review in practice.
Here is the same calculation for your own PRs. Paste one line per merged PR, its size and its hours to first review. The demo’s --csv prints exactly this for any repository, and the default is grafana’s 857. Pick how the pieces would be reviewed and how many there are, press Run, then read the two ends in the comparison, Fit says and If size does not matter. Change the way they’re reviewed as well as the count, because that’s the decision being priced. With a few hundred PRs the fit is worth reading; with a few dozen, the bootstrap range will tell you it isn’t:
The tool’s bootstrap range comes from its own resampling, so its range can differ from the script’s by a few hundredths.
What small PRs buy
The waiting is one side of the decision. The other is in the same data. The grafana table above has a column I skipped: review threads per 100 lines changed. A review thread is a comment thread opened on a line of the diff, by anyone.
| Repository | Threads per 100 lines, PRs of 11 to 50 lines | PRs of 501 to 2,000 lines | Ratio |
|---|---|---|---|
| astral-sh/ruff | 1.81 | 0.54 | 3.4 |
| grafana/grafana | 1.05 | 0.35 | 3.0 |
| pola-rs/polars | 0.96 | 0.21 | 4.6 |
From each repository’s size table.
Small PRs get 3.0 to 4.6 times as much discussion per line. Two cautions on that number. “By anyone” includes review bots and AI reviewers, and on grafana they’re far commoner on large PRs: 54% of PRs of 501 to 2,000 lines had a review from a bot, against 15% of PRs of 11 to 50 lines. So the gap between people is probably wider than this. And it’s per line: per PR, large PRs get more threads, not fewer.
That’s the ferry’s deckhand looking more closely when there are fewer cars. Whether the extra discussion catches more bugs, the counts can’t say. They also don’t show that a reviewer taking eight pieces in one sitting would discuss them as much as eight separate small PRs.
What review is for is a question the research has looked at directly. Bacchelli and Bird studied review at Microsoft, through observation, interviews, 570 classified comments and surveys of 165 managers and 873 programmers. They found that “although the top motivation driving code reviews is finding defects, the practice and the actual outcomes are less about finding errors than expected”, while review “additionally provides a wide spectrum of benefits to software teams, such as knowledge transfer, team awareness, and improved solutions to problems” (Expectations, Outcomes, and Challenges of Modern Code Review, ICSE 2013). If that’s what review is for, more discussion per line is worth having, and smaller PRs get more of it.
So splitting buys more discussion per line, and it costs waiting. What I want is a change in pieces a reviewer can follow, without each piece going back through the queue.
Change the pickup, not just the line limit
In the tables, the only way that’s never worse than one PR is the one where the pieces are reviewed together. And every multiple is a multiple of one pickup, so the cheapest lever of all is making the ferry run more often.
For a team adopting a small-PR guideline, I’d agree the review arrangement at the same time:
- Book one sitting for related pieces. Split the change so it’s easier to read, not so it enters the queue eight times. A stacked PR is one of a chain of PRs, each built on the one before, so they can be read in order and merged one by one. Make the relationship explicit, and agree who takes the whole stack. A stack one reviewer takes in order, in one go, gets the per-line discussion of small PRs and the wait of one pickup. Without that agreement, eight small PRs are still eight separate items in someone’s queue. Tools that manage stacks make this easier; a message saying “these four go together” works too.
- Keep the pieces in the owning team’s queue, and make each one safe to ship. Amazon’s Builders’ Library describes deployment pipelines in which every commit on the mainline branch “must be code reviewed and approved by a member of the service team for that pipeline”, and where “the code review is the last manual review and approval that a code change receives from an engineer before being deployed to production” (Automating safe, hands-off deployments, Clare Liguori). That settles who reviews a split change before the first piece is opened. It also means each merged piece is a deployment of its own, so a reviewer can’t leave a problem for the next piece to fix: each one has to be safe to deploy and roll back by itself.
- Shorten the pickup, not the PR. Review slots at the start and end of the day, a rotation so someone is always on review, and a rule like Google’s one business day. Every multiple in the table is a multiple of the pickup, so halving the pickup halves all of them, however the change is split.
- Chase the slow tail. Meta measured this directly. They took the slowest quarter of reviews as their target, and a bot that nudged likely reviewers on diffs (their name for PRs) waiting too long cut “the average Time In Review for all diffs” by 7% and “the proportion of diffs that waited longer than three days for review” by 12% (Move faster, wait less, 2022). That’s a different measure from the pickup wait here, but it’s direct evidence that changing the process helps. The slowest pickups are also the ones that set the side-by-side number.
What other studies found
Kudrjavets, Nagappan and Rastogi looked at 845,316 pull requests from 100 projects and found that “pull request size and composition do not relate to time-to-merge” (Do Small Code Changes Merge Faster?, MSR 2022). Time to merge covers much more than the first review measured here.
Stepanović, looking at “over 40,000 PRs from more than 40 very active repositories of product development teams”, found that smaller PRs wait longer per line. He concludes that teams should write and review code together, by pairing (two people at one change) or mobbing (the whole team at one change), so there’s no queue to wait in (From Async Code Reviews to Co-Creation Patterns).
Both point past diff size, and the split rule here is a way to put a number on the cost they describe, for your own repository. Neither makes ruff’s or grafana’s exponent transfer to another team.
What I’d check before using the numbers
- Correlation, not cause. It’s the one that matters most, and it’s why every price above is a range. Urgency, who wrote it, the kind of change and who reviews it can all affect both size and wait. The fit describes who reviewed what on these projects. It doesn’t predict what happens when you change how you split.
- Who’s left out. Bots’ PRs, PRs nobody else reviewed, and PRs not yet merged. The first
<details>above counts them, and says which part of each curve they thin out. - Open source isn’t a company team. These projects are reviewed mostly by maintainers spread across time zones. The direction matches what Kudrjavets and Stepanović report from other data; the exponents may well not transfer. Run the tool on your own repository before using any of them, and check first what your team’s “ready for review” and review timestamps actually record.
- One reviewer is one queue. If one person reviews everything, it depends how they work through the pieces. Taking them together is “in one sitting”. Putting each back in their ordinary queue, one at a time, is closer to “one after another”. Calling the PRs a stack doesn’t decide which.
- Only the first wait. Rounds of comments, CI and merge conflicts aren’t counted, and a stack of eight PRs adds rebasing that one PR doesn’t. Those can dominate how long a feature takes to ship.
- A window, not a constant. Each repository’s 1,000 PRs cover between three weeks (grafana) and four months (polars). A different window would give a somewhat different e. The real uncertainty is at least as wide as the bootstrap range, and wider still once the three-minute floor is counted.
Run it on the snapshot or your own repository
The code is in code-review-economics/, standard library only, with the three repositories’ PRs committed in data/ so it runs without a GitHub token. Fetching another repository needs the GitHub CLI.
cd mainlog-code/code-review-economicspython3 split_cost.py data/*.jsonl # the tables abovepython3 split_cost.py --csv data/grafana_grafana.jsonl # size,wait pairs for the toolpython3 fetch_prs.py your-org/your-repo 1000 > data/your-org_your-repo.jsonl # needs the GitHub CLIpython3 -m unittest discover -s testsIts CI runs on the committed snapshot only and checks the script’s whole output against the run quoted here, so the post doesn’t drift as the three projects keep merging. The share of PRs with a bot review and the median and mean pickup for one 800-line PR are printed too, on one line per repository:
with a bot review: 15% of PRs of 11-50 lines, 54% of 501-2000; one 800-line PR on the fit: median pickup 2.1 h, mean 34.2 hSo should you open one PR or eight? I’d arrange the review first, then choose the pieces. Eight, if one reviewer will take them together: the reviewer gets eight small pieces to discuss, and you wait no longer than for one big PR, and less if size does drive the pickup. Eight in a row, and on grafana’s numbers the feature waits nearly five to eight times as long. “Under 200 lines” becomes useful advice when the team also answers who will read those lines, and when.
Related posts

Keeping optional Python imports optional
A test that checks importing a library leaves its optional dependency unloaded, and proves it got far enough to notice.
The unwritten rulespythontesting
Every latency number answers one question
A checkout page hangs while the dashboard says 23 ms. The mean, a percentile and a share under a threshold each answer a different question, only two of them add up across hosts, and an averaged p99 can be wrong by a factor of three in either direction.
The unwritten rulesobservabilityperformancestatistics
Green on my laptop, red in CI
A pytest plugin passed every test from the source checkout and failed twice in CI, because only the installed wheel told pytest the plugin existed.
The unwritten rulespythontesting
 Software craft
Keeping optional Python imports optional
A test that checks importing a library leaves its optional dependency unloaded, and proves it got far enough to notice.
pythontestingAug 2026 Systems
Every latency number answers one question
A checkout page hangs while the dashboard says 23 ms. The mean, a percentile and a share under a threshold each answer a different question, only two of them add up across hosts, and an averaged p99 can be wrong by a factor of three in either direction.
observabilityperformanceAug 2026 Software craft
Green on my laptop, red in CI
A pytest plugin passed every test from the source checkout and failed twice in CI, because only the installed wheel told pytest the plugin existed.
pythontestingSep 2026
Comments