Backpressure and load shedding
Someone has to hear no. The queue decides who, and how soon.
On this page · 9 sections
It’s 09:59, and you run the checkout service for the small online shop from the observability post. The service takes a cart, prices it and charges the card. It has 8 workers, and each request takes about 80 ms, so it can answer about 100 requests a second. Traffic is around 70 a second, and the service is comfortably busy.
At 10:00 a sale opens. For one minute, 150 requests a second arrive. One in five is a customer placing an order. The other four are price previews, which the checkout page asks for while people edit their carts. The shop’s app waits 2 seconds for each attempt, and a person gives up altogether after about 10.
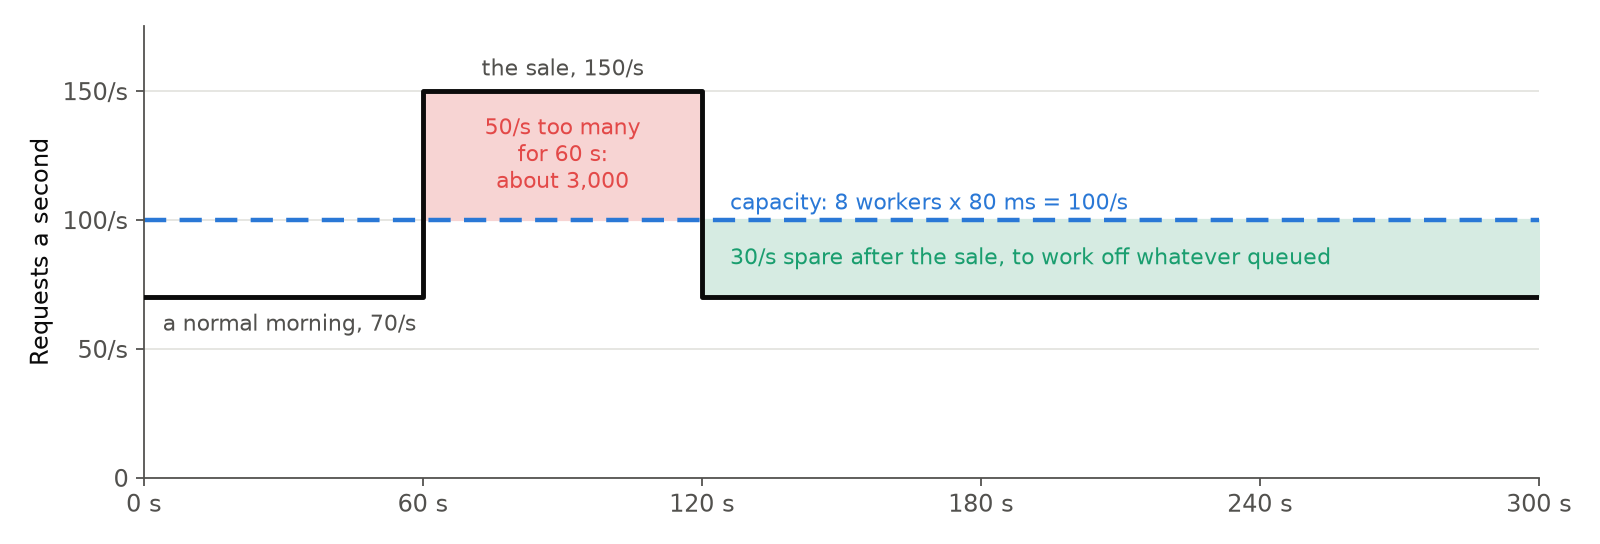
For that minute your service is short by 50 requests a second. A queue can’t supply the missing workers. It can only decide where the extra work waits, and who gets served. Nothing you do inside the service changes that arithmetic, so someone isn’t going to be served. What you can still decide is who that is, and how quickly they find out.
I’ve built services where that arithmetic is a design input rather than an accident, among them an ad-targeting system at over 100 requests a second and 99.9% availability. The thing I’ve learned to check first isn’t the capacity. It’s what the service does with the request that doesn’t fit. Usually nobody decided. The framework did, and what it decided was to queue it.
The short version
- Your checkout service can answer 100 requests a second. For one minute, 150 arrive.
- Left at the usual default, one queue with no limit, it answers 8.4% of the people who arrive during the sale. The other 91.6% wait the full 2 seconds and get nothing, while the workers stay busy serving people who have already left.
- Turn the overflow away at once, with a short queue or a limit on how long a request may wait, and 64 to 67% are answered. Capacity allows two thirds, so that’s nearly all of it.
- Set the queue’s limit in units of time. 50 waiting requests are half a second of work here. A limit of 1,024 is over ten seconds, against a 2-second timeout, and it behaves like no limit at all.
- Which third hears “no” is the product decision. Putting orders first answers 100% of the people paying, at the same total.
- Give the clients retries and the queue with no limit never recovers: nobody is answered in the three minutes after the sale, at a load it normally handles easily.
The queue at the support desk
The same overload happens at a live-chat support desk, and it’s easier to see there. Eight agents answer chats, each agent one chat at a time. On a normal morning a few chats wait, and the queue moves. On the morning of the sale, the queue grows faster than the agents can clear it. People at the back wait a few minutes, decide it isn’t worth it, and close the tab. Their chats stay in the queue, though, and nobody tells the agents. When an abandoned chat reaches the front, an agent still reads it, looks up the account and types a careful reply to someone who left ten minutes ago.
A desk has better options than that. The chat widget could tell new arrivals that the queue is full and to try later. It could say “we’re busy, please try again at 10:30”. A chat that nobody picked up in time could be closed with an apology instead of answered late. During a rush, agents could take the newest chat first, because that person is the most likely to still be at the screen. And priority tickets, say a payment that failed, could go ahead of routine questions, answered by the same eight agents.
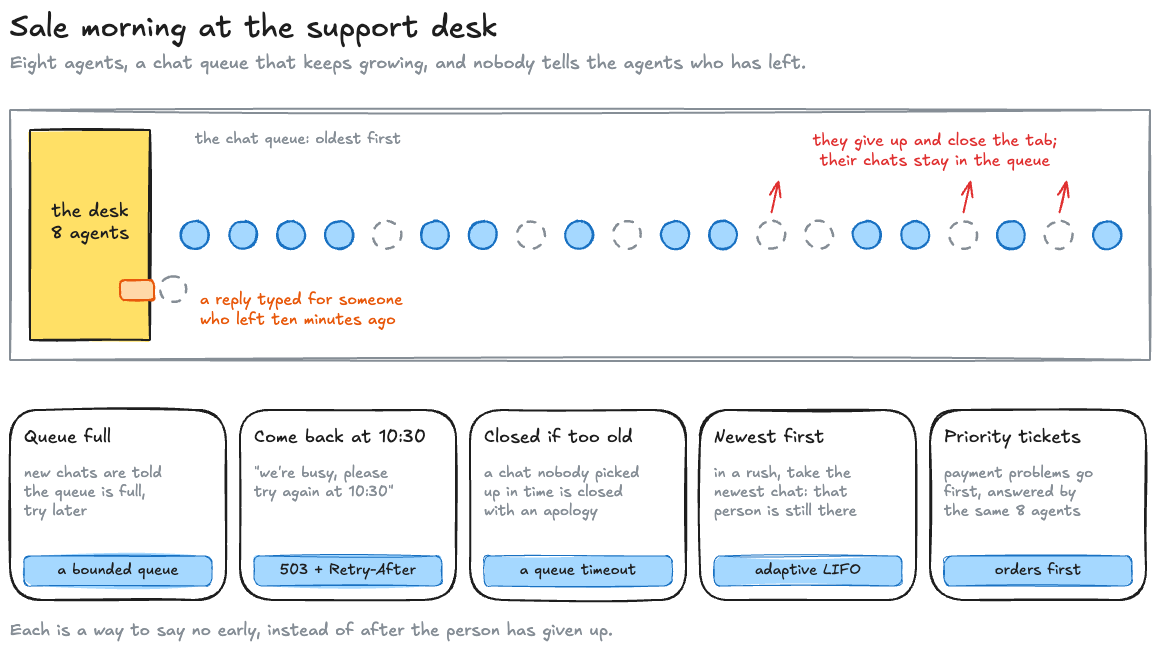
The desk maps closely, with one difference worth saying. A real desk taking the newest chat first would feel unfair to the people who have waited longest, and most desks wouldn’t do it. A request from a browser has no such claim: a request whose client has given up is worth nothing, however long it waited.
The demo I wrote for this is a model of exactly your morning: a seeded simulation of the checkout service, every request and every give-up, run under six policies for the request that doesn’t fit. It runs for five minutes: one minute at normal traffic, the minute of the sale, and three minutes afterwards. It’s a model, not a measurement, and I’ll say where it’s simpler than a real service as we go. Every number below comes from it, and the lab and the tool further down let you change it.
Two of its measurements need defining before we use them. A person is answered in time if they get a useful response within the app’s 2 seconds. Retries change that a little, and we’ll come to them. Wasted work counts requests a worker finished after their client had already given up. The answered shares are for the people who first arrived during the sale. The wasted-work counts cover the whole run.
Busy workers, almost no useful answers
Most frameworks start you with one queue, first come first served, and no limit: an unbounded queue. Every request enters it and waits until a worker is free, however long that takes. No worker checks whether the caller is still waiting. Here’s what that does to the sale:
| Unbounded queue, no retries | During the sale |
|---|---|
| Answered in time | 8.4% |
| Waited 2 s and got nothing | 91.6% |
| Requests finished for someone who had already gone | 14,309 |
| Back to normal | 90 s after the sale ends |
Back to normal means the first 10 seconds after the sale from which every later 10 seconds answers at least 90% of its people.
The reason it’s so bad is simple. For that minute the queue grows by 50 requests every second. At 100 answered a second, a queue of 200 is 2 seconds of waiting, and 2 seconds is when the app gives up. The queue reaches 200 after seconds. From then on, nobody who joins it is answered in time, because everyone ahead of them is served first, including all the people who have already left. That back-of-the-envelope estimate says 4 seconds out of 60, which is 6.7%, and the simulation’s 8.4% is close to it.
The service isn’t idle in all this. It works flat out, at full capacity, the whole time. It’s just doing the wrong work. This is where the simulation counts it, when a worker finishes a request:
else: # done busy -= 1 if a.gave_up: wasted += 1 else: a.finished = True useful += 1 # ...a.gave_up is set when the app’s 2 seconds run out. Nothing tells the worker, though, so it serves the request anyway, and the simulation can only count it afterwards. By the end of the run, 14,309 requests have been served to nobody.
David Yanacek’s article on load shedding at AWS has the best description of it I know: “the server keeps working on the request, and its late reply is like a tree falling in the forest. From the server’s perspective, it has returned a successful response. But from the perspective of the client that timed out, it was an error” (Using load shedding to avoid overload). His word for the useful part is goodput: the requests handled “without errors and with low enough latency for the client to make use of the response”. In the sale, throughput stayed at 100 a second for the whole minute. Goodput fell to nothing: of the people who arrived in five of the sale’s six 10-second windows, none was answered.
The Google SRE book says the same thing more briefly: “you don’t get credit for late assignments with RPCs” (Addressing Cascading Failures).
The trouble outlasts the sale, too. Sixty seconds at 50 too many a second leaves a backlog of about requests. Once traffic drops back to 70, the service has only the 30 a second it has spare to drain it, so the rough estimate is seconds. The simulation is back to normal after 90. People arriving at 10:01 join the back of that queue, and for those 90 seconds they wait for nothing too.
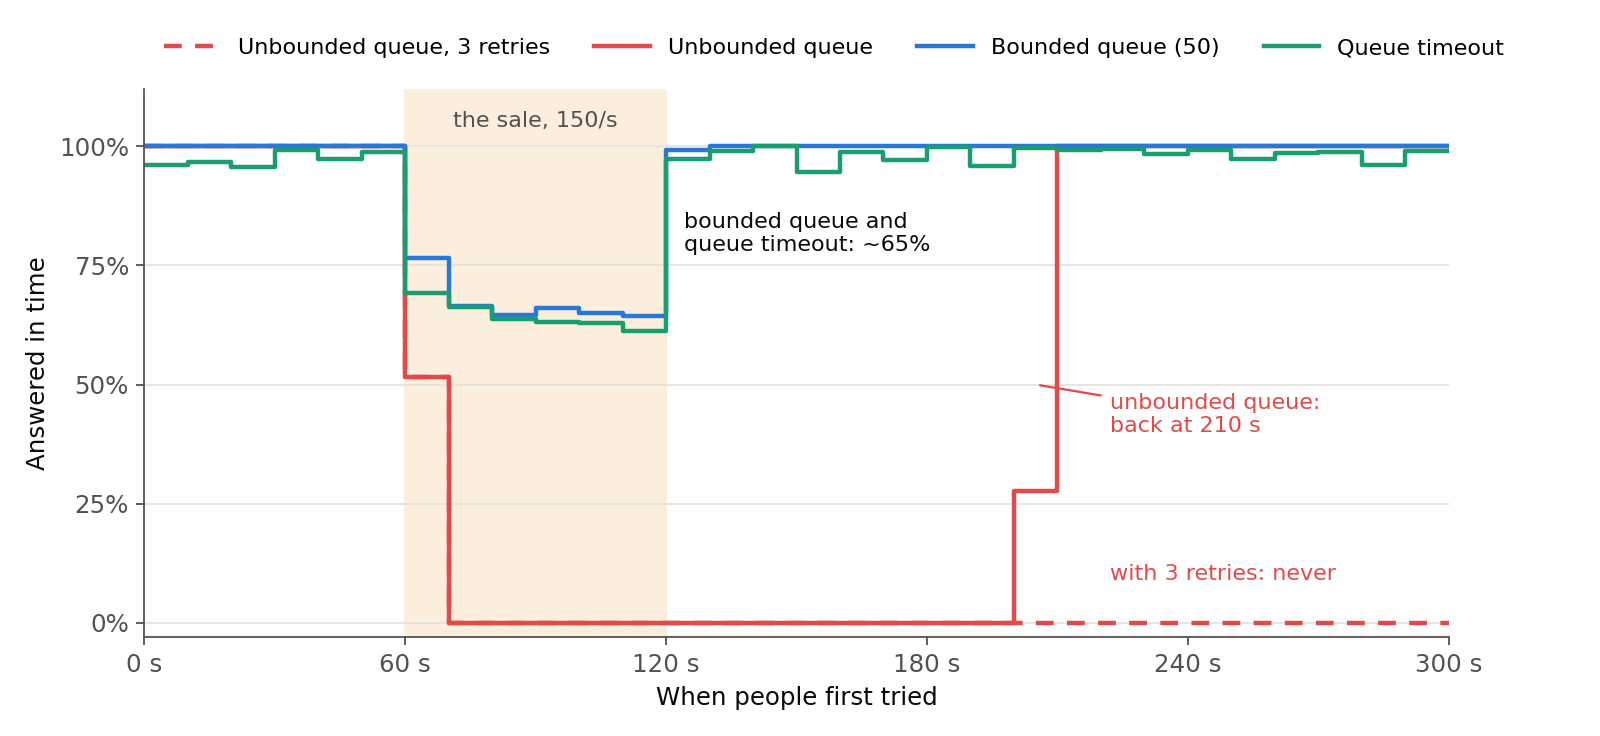
The second policy is the obvious first improvement: skip the abandoned, which means a worker drops a request whose client has already left, instead of serving it. That raises the sale’s answered share from 8.4% to 19.5%, and the service recovers as soon as the sale ends. Most requests still reach a worker after waiting nearly 2 seconds, though, so many of them run out of time while they’re being served. So dropping dead work helps, but the queue is still too long. The policies that work stop it getting that long in the first place.
Backpressure needs a sender that can listen
There are two ways to stop a queue growing, and they’re often confused.
Backpressure means telling the sender to slow down. It works when the sender is a program that can wait: a stage in a stream processor, the producer feeding a message consumer, or a database driver. The cleanest form I know is in the Reactive Streams specification. A consumer says how many items it’s ready for, and the producer may never send more than that. At the support desk, it’s telling an internal team whose system files tickets through an API to send fewer. A customer in a chat window can’t be slowed down that way.
Load shedding means saying no. It’s what’s left when the sender can’t be slowed down, and a person in front of a browser can’t be. Fred Hebert put the choice in one line in 2014: “You’ll have to pick between blocking on input (back-pressure), or dropping data on the floor (load-shedding)” (Queues Don’t Fix Overload). A queue doesn’t get you out of picking one. It only postpones the choice, and in his words, “You’re making failures more rare, but you’re making their magnitude worse.”
At the edge of a web service, then, backpressure becomes a fast no that carries a hint, and HTTP already has both halves. A 503 says the server “is currently unable to handle the request due to a temporary overload”, and it may carry a Retry-After header “to suggest an appropriate amount of time for the client to wait before retrying” (RFC 9110 §15.6.4). A 429 is the same idea for one client that’s sending too much (RFC 6585 §4). That’s the desk’s “we’re busy, please try again at 10:30”: no, but come back later. The client still has to respect it. A client that retries at once turns a cheap refusal into one more arrival at the same overloaded service.
Bound the queue, or bound the wait
The simulation has three policies that say no early. The bounded queue is the chat widget saying the queue is full. The queue timeout is the chat closed with an apology because nobody picked it up in time. Newest first is the agents taking the newest chat during a rush.
The simplest is a bounded queue. At most 50 requests may wait, and the 51st is refused straight away. At the shop’s rate of 100 a second, 50 waiting requests are about half a second of work. With no retries, this answers 67.1% of the people who arrive during the sale and refuses the other 32.9%. None of them times out, and those who are answered wait a median of 550 ms, including the 80 ms of work.
The 50 is really a time. At 100 a second it’s half a second of waiting, well inside the 2-second timeout, so nobody the queue admits can time out in it. A bound of 1,024 holds over ten seconds of work, and it answers 8.4%, no more than no bound at all. The rule is that a bound sheds only if , the time it takes to work through a full queue, is shorter than the caller’s timeout.
A count works while you know how quickly the queue drains. A limit on time follows what the customer actually experiences more directly. The second policy is a queue timeout, a limit on how long a request may wait. It’s the variant of CoDel (controlled delay, an algorithm first designed for network routers) that Facebook described in Fail at Scale (Ben Maurer, ACM Queue, 2015). The article’s rule is this: “if the queue has not been empty for the last N milliseconds, then the amount of time spent in the queue is limited to M milliseconds. If the service has been able to empty the queue within the last N milliseconds, then the time spent in the queue is limited to N milliseconds.”
It also gives the values: “We have found that a value of 5 milliseconds for M and 100 ms for N tends to work well across a wide set of use cases.” In practice, a request’s allowance depends on what it finds when it arrives:
| When the request arrives | It may wait | Why |
|---|---|---|
| The queue has emptied in the last 100 ms | 100 ms | An ordinary burst, which the queue should absorb |
| The queue hasn’t emptied for more than 100 ms | 5 ms | A standing queue, one that isn’t clearing, which shouldn’t be allowed to grow |
The article’s pseudocode decides each request’s limit as it arrives, and the simulation does the same:
if cfg.policy in ("codel", "lifo"): # Fail at Scale's onNewRequest: if the queue has not been empty for the last N, this request # may wait M; otherwise it may wait N. Decided now, from the queue as this request finds it. if not queue: last_empty = now a.limit = target if now - last_empty > interval else intervalqueue.append(a)target is the 5 ms and interval the 100 ms. The limit is enforced later, when a worker picks the next request up:
congested = now - last_empty > intervala = queue.pop() if cfg.policy == "lifo" and congested else queue.popleft()if cfg.policy in ("codel", "lifo"): # The limit set when it arrived, enforced as a worker picks it up. if now - a.t0 > a.limit: if not a.gave_up: refuse(a, now) continueThis is a check at pickup, not a timer that removes each request at exactly 5 or 100 ms. It refuses work that has waited too long before any worker time is spent on it. A request whose client has already gone is dropped without a reply, since nobody is listening for one.
The third policy, newest first, keeps the queue timeout and adds the same article’s adaptive LIFO (last in, first out): “During normal operating conditions, requests are processed in FIFO order, but when a queue is starting to form, the server switches to LIFO mode.” That’s the queue.pop() in the excerpt above. The newest request is the one whose customer is most likely to still be there. Yanacek makes the same observation in a second AWS article, about queues of messages rather than requests: “Real time systems often are implemented with FIFO-ish queues, but prefer LIFO-ish behavior” (Avoiding insurmountable queue backlogs).
All three land in the same place:
| Policy, no retries | Answered in time | Told no | Waited for nothing | Median wait of the answered |
|---|---|---|---|---|
| Unbounded queue | 8.4% | 0% | 91.6% | 1,125 ms |
| Bounded queue (50) | 67.1% | 32.9% | 0% | 550 ms |
| Queue timeout (5 ms / 100 ms) | 64.4% | 35.6% | 0% | 98 ms |
| Newest first | 64.3% | 35.7% | 0% | 81 ms |
From shed_sim.py, for the people who first arrived during the sale. The wait includes the 80 ms of work.
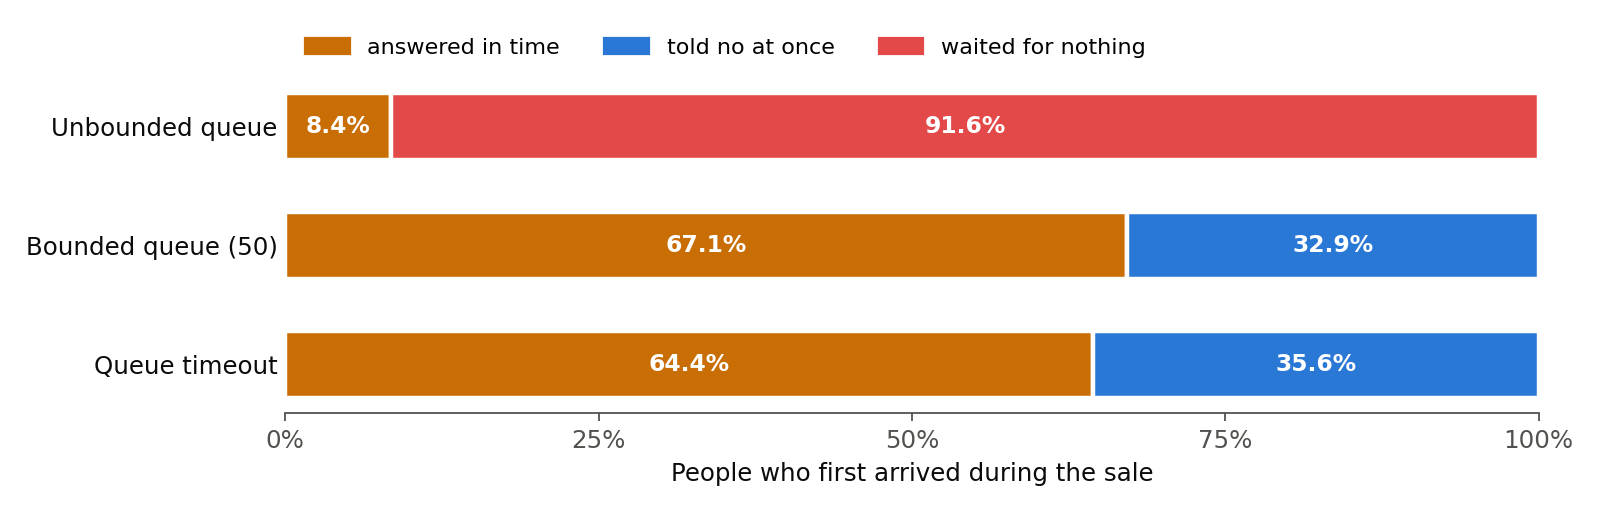
Capacity sets the ceiling. 100 answered out of 150 arriving is two thirds, and every early-no policy gets within a few points of it. So the first decision, how many people get served, isn’t really a decision at all. Any bounded policy gets close to the ceiling, and the unbounded queue doesn’t. I’d call the unbounded queue a defect with a default setting rather than a trade-off.
What’s left between the three is how long the answer takes. The bounded queue lets 50 wait, which is half a second of work, so the people it answers wait about 550 ms. The queue timeout answers slightly fewer, with a median of 98 ms. If it were my service, I’d take the queue timeout for that alone.
There’s a cost, though, and the model shows it. At the shop’s normal 70 requests a second, with no sale at all, the queue timeout turns away 1.7% of requests, and the bounded queue none. The article says “the values of M and N tend not to need tuning”. In this model, with 8 workers and 80 ms requests, those values cost about 2% of requests on an ordinary morning, because a policy tuned to shed quickly can be too impatient with an ordinary burst. That’s worth checking against your own numbers before you take the defaults.
Why the bound is a time, not a count
A bound of 1,024 answers the same 8.4% as no bound, but it isn’t identical. With no retries it refuses 22% at once, and is back to normal 30 seconds after the sale instead of 90. With 2 retries, a bound of 300 or more never recovers, while 50 or 150 recover at once.
Treat the rule as a starting estimate rather than a guarantee: leave room for the service time and its variation, and measure the waits you get. 1,024, as it happens, is the default limit on pending requests in Envoy, a proxy we’ll meet in the next post.
The SRE book makes the same point from the other side: “it is usually better to have small queue lengths relative to the thread pool size (e.g., 50% or less), which results in the server rejecting requests early when it can’t sustain the rate of incoming requests” (Queue management).
Which requests get the scarce workers?
Every bounded policy above turns away about a third of the people at random. Most of them are only asking for a price, but one in five is trying to pay. Treating them equally is a policy too, whether anyone wrote it down or not. That’s where the product decision is: which customers matter most when not everyone can be served?
The fourth policy answers it one way. It’s the bounded queue with one change. When the queue is full and an order arrives, the newest price preview in the queue is turned away to make room. At the support desk, it’s a priority ticket: the same eight agents, but when the queue is full and a payment problem comes in, the newest routine question is closed to make room.
| Bounded queue (50), no retries | Everyone | Orders |
|---|---|---|
| Plain | 67.1% | 68.4% |
| Orders first | 67.1% | 100% |
The total is the same, to the decimal, and every payer is answered. The policy hasn’t created any capacity. It has handed the same capacity out differently, and the previews absorb all of the refusals. They’re also the requests best placed to absorb them: for a customer, a refused preview costs a price that updates a second later, or a “busy, try again”, rather than a lost sale. It works here because orders arrive at about 30 a second during the sale, well under the service’s 100. If the orders alone exceeded capacity, no priority could answer all of them.
Google formalised this into criticality levels on every request, from CRITICAL_PLUS down to SHEDDABLE, so that an overloaded server knows what to drop first (Handling Overload). I’ve found the labels matter less than the conversation that produces them. A queue can’t work out that a purchase matters more than another preview. Which requests are which is a question for whoever owns the product, and it’s much better answered on a quiet Tuesday than during the sale.
The sale ends. The retries don’t.
So far no one retries. Real clients do: the app’s HTTP library, the mobile SDK, and sometimes the person pressing the button again. At the support desk, it’s the people who closed the tab opening a new chat a minute later, at the back of a queue that’s already too long, while their first chat may still be waiting.
With retries, a person can fail and still succeed later, which is why “answered” is counted per person, within their 10 seconds. Give every client 3 retries, about a second apart, after either a timeout or a refusal. That’s up to 4 attempts, each with the app’s 2 seconds. Then run the sale again:
| 3 retries | Answered during the sale | Back to normal |
|---|---|---|
| Unbounded queue | 8.4% | not by 300 s |
| Bounded queue (50) | 69.0% | at once |
| Queue timeout | 68.6% | at once |
The bounded policies barely notice. A refused request comes back a second later and often gets in, so retries move a couple of points from “told no” to “answered”. The price is a longer wait for the people answered on a later try.
The unbounded queue never comes back. The sale ends at 120 s, demand drops to the 70 a second the service handles every morning, and for the remaining three minutes it answers nobody who arrives. The same arithmetic as before explains it. Once the queue holds more than 2 seconds of work, every attempt times out, so every person sends all 4 of their tries. That’s requests a second against a capacity of 100, so the queue can’t shrink. Even one retry is enough, since is still over 100. The simulation prints the same calculation for each retry count. It calls it the fluid view, because it treats requests as a steady flow rather than as individual arrivals:
...The fluid view: after the sale, an unbounded queue drains only if every person's tries fit retries=0: 70/s x 1 tries = 70/s against 100/s, drains retries=1: 70/s x 2 tries = 140/s against 100/s, never drains retries=2: 70/s x 3 tries = 210/s against 100/s, never drains retries=3: 70/s x 4 tries = 280/s against 100/s, never drainsOnly the first line drains, which is why the simulated runs with 1 or 3 retries answer nobody to the end.
This has a name: a metastable failure. Bronson and his co-authors define it as one where “a trigger causes the system to enter a bad state that persists even when the trigger is removed”. What holds it there is what they call a sustaining effect, such as retries multiplying the work (Metastable Failures in Distributed Systems, HotOS 2021). In your service, the sale was the trigger, and the retries are what keep it down. Their warning is the part I’d put on the wall: “It is common for an outage that involves a metastable failure to be initially blamed on the trigger, but the true root cause is the sustaining effect.”
Marc Brooker makes the same point about retries specifically. They can make the error rate go down day to day while “converting small outages into sudden (and metastable) periods of internal retry storms” (Metastability and Distributed Systems). His article for AWS puts the mechanism plainly: “Retries can amplify the load on a dependent system. If calls to a system are timing out, and that system is overloaded, retries can make the overload worse instead of better” (Timeouts, retries, and backoff with jitter).
Try it yourself in the lab below, which has all 162 combinations recorded. Pick the unbounded queue, click through the retries, and watch the bars after the shaded sale. Then pick any other policy and do the same. Two more things are worth trying. First, make the sale 200 a second with no retries. The unbounded queue isn’t back by 300 s either, but that’s a backlog too long for the three minutes rather than a stuck queue, and the lab says which. Second, change the client’s timeout. A longer one buys time but not capacity: it helps the unbounded queue a little, 3.5% answered at 1 second and 16.5% at 4, and fixes nothing.
This lab runs a real call in your browser, so it needs JavaScript.
What else the 10 seconds decides
A retry that would start more than 10 seconds after a person’s first try is never sent, and a success after those 10 seconds counts as late, which is a failure. So the 69.0% for the bounded queue with retries includes people answered on their second or third try, and their wait is measured from their first. The 10 seconds also caps the retries that matter. With a 4-second timeout, only 2 tries fit in 10 seconds, whatever the retry count says, so multiplying the normal rate by every configured attempt is only right when those attempts fit.
Saying no has to be cheap
Every policy above refuses for free: a full queue says no without spending any worker’s time. Real services rarely manage that. Before the code that decides “too busy” runs, something has usually parsed the request, checked who’s asking, and maybe loaded the cart. At the support desk, it’s an agent who has to open and read each chat before saying they can’t take it. Yanacek’s article says it plainly: “the act of shedding load isn’t free”.
The simulation can charge for the no. Make each refusal take a worker for some milliseconds first, and the bounded queue does this:
| Worker time spent before refusing | Answered during the sale |
|---|---|
| 0 ms | 67.1% |
| 20 ms | 56.9% |
| 80 ms, as much as serving it | 0.7% |
At 20 ms, about a sixth of the workers’ time goes to refusing, and about a sixth of the answers go with it. At 80 ms, saying no costs as much as saying yes, so the refusals use up the very workers the bound was meant to protect. The result is worse than no bound: 0.7% answered, against the unbounded queue’s 8.4%.
So the place to shed is as early as the request can be recognised: in a gateway or load balancer in front of the service, or in the first few lines of the handler, before anything expensive. A full-queue check doesn’t need the cart priced first. A priority decision is different, because it needs enough of the request read to tell an order from a preview, and that reading is part of what it costs.
Four decisions to make before the sale
When I design a service that might see a spike like this one, these are the decisions I want made, and written down, before it happens:
- The queue bound, as a time. How long may a request wait before it’s no longer worth serving? It has to be shorter than the caller’s timeout, with the service time in view. Then turn that into a count, or use a queue timeout and skip the count.
- What the no says. A 503 with a Retry-After, sent in milliseconds, and a client that honours it, so the people turned away know when to come back.
- Who goes first. Which requests are the orders, and which can wait. This is the product conversation.
- A retry budget. Retries should stop when they stop helping. The SRE book’s version is at most three attempts per request, and retries only while they’re under 10% of a client’s requests (Handling Overload). Brooker’s AWS article describes another, “limiting retries locally using a token bucket”, an allowance of retries that refills at a fixed rate, so every call may retry while the allowance lasts, and after that only at the refill rate. The demo’s client, with 3 retries and no budget, sends up to 4 attempts, which is more than either allows. Without a budget, the first big spike can be the one that never ends.
In my experience each of the four has usually been decided already, by a default, and nobody has looked at it.
To check your own service, the load shedding simulator runs this same model with your numbers. It starts on the shop’s, so press Run to see the sale, or pick a sample such as “Unbounded, with 3 retries”. Then change the policy, workers, service time, traffic, timeout, retries and queue size. Left at 0, the queue size is set for you at a quarter of the timeout’s worth of work, which is 50 at the shop’s numbers. The sample “The sale, Envoy’s 1,024” shows what Envoy’s default does to the sale: a 1,024 queue holds 10.2 s of work against a 2 s timeout, so 69.6% of requests still wait for nothing.
It leads with every policy side by side, as bars and then as a table, followed by a chart of your own policy over time. Two lines under the chart are worth reading together. “Once everyone times out” says whether a spike could leave your queue stuck, and “This run” says what actually happened. For a policy that can’t hold anyone that long, the first line is “Longest wait in the queue” instead. Last comes what to change. On the shop’s numbers, it suggests the bounded queue, or 13 workers, the fewest whose capacity is over 150 a second.
To size the workers in the first place, the queueing capacity planner answers a different question. Given the arrival rate and the service time, it finds the fewest workers that keep the share of requests that wait at all, or that wait longer than a limit you set, under a target. It uses Erlang C, the classic formula for an M/M/c queue. That means requests arriving at random, service times that are mostly short with a few long ones (an exponential distribution, the same one our simulation uses), and c identical workers.
Its answer is the number of workers, beside what one fewer would cost. It opens on its own example, 120 a second and 45 ms. Put in the sale’s 150 a second and 80 ms instead, keep its 5% target, and it says 19 servers. With 18, 7.56% of requests wait; with 19, 4.35%. Expand it to see the nearby worker counts with their p99 waits, and a chart of how sharply waiting rises either side of the answer. The simulator’s 13 is the fewest workers that keep up with 150 a second on average. The planner’s 19 is what it takes for fewer than 5% of those requests to wait at all. That answer assumes 150 a second is sustained traffic and that nobody gives up, and it knows nothing about this post’s policies or retries. It sizes capacity for a workload you expect. The simulator tests what happens when the work offered briefly exceeds it.
Where the model is simpler than a real service
Service times here are exponential, with a mean of 80 ms. Real ones have a heavier tail, with a few requests taking many times the median, and a heavier tail makes every policy worse, because it makes queues longer at the same load. Arrivals are random and independent, while real retries arrive in bursts, which is worse again.
There is one pool of workers and one queue. A real request may wait at a proxy, in an application’s thread pool, for a database connection and inside the database, so bounding one queue doesn’t bound the whole path. The next post looks at what happens when every one of those hops retries.
And the simulation is seeded, so it prints the same numbers on every machine. With another seed the shares move by a point or so. These runs compare mechanisms under stated assumptions; they aren’t a promise about any production success rate.
Run the sale yourself
The simulation is backpressure/ in mainlog-code. It needs nothing beyond Python’s standard library:
cd mainlog-code/backpressurepython3 shed_sim.py # the tables in this postpython3 shed_sim.py --timeline # answered per 10 s, every policypython3 shed_sim.py --policy fifo --retries 1 --spike 150 # one run, your numberspython3 export_runs.py > runs.json # the lab's 162 recorded runsIt uses its own seeded random number generator rather than Python’s, so the load shedding simulator, which runs the same model in TypeScript, prints the same numbers for the same inputs. Its CI runs the script and checks the numbers in this post’s tables, the bound comparisons, and that the lab’s recorded runs are what the script exports.
So your sale goes one of two ways, from the same eight workers. Two thirds of the customers are answered, every payer among them, and the rest are told quickly to come back. Or a few percent are answered, and the workers spend the next minute and a half answering people who left. Next, in the service mesh post, the checkout service becomes one of many, and every call between them goes through a proxy that retries on your behalf.
Related posts

What a service mesh costs
Your shop now runs 14 services in three languages, and security wants every call between them encrypted and identified. A mesh does that without touching the code, for about a fifth of a millisecond per hop and a tenth of a core per proxy per 1,000 requests a second, measured here with real Envoy. It also brings retry and queue defaults nobody chose. Over plain HTTP they retry less than most people expect; over gRPC, or after one common edit, a failing service gets 27 calls for one checkout.
Down to the wireinfrastructuremicroservicesnetworking
Observability-driven development
A deploy makes checkout slow for 0.9% of requests, and the dashboard's median doesn't move. Writing down the question you'd ask if it broke, and making a test prove the telemetry can answer it, is what finds them. Plus what that telemetry costs, in series and in microseconds.
Down to the wireobservabilitydistributed-systemstesting
More samples, same sound
Converting audio to a higher sample rate makes it fit the next program; it cannot bring back sound an earlier step removed. Three test tones show why.
Down to the wireaudioperformance
 Systems
What a service mesh costs
Your shop now runs 14 services in three languages, and security wants every call between them encrypted and identified. A mesh does that without touching the code, for about a fifth of a millisecond per hop and a tenth of a core per proxy per 1,000 requests a second, measured here with real Envoy. It also brings retry and queue defaults nobody chose. Over plain HTTP they retry less than most people expect; over gRPC, or after one common edit, a failing service gets 27 calls for one checkout.
infrastructuremicroservicesOct 2026 Systems
Observability-driven development
A deploy makes checkout slow for 0.9% of requests, and the dashboard's median doesn't move. Writing down the question you'd ask if it broke, and making a test prove the telemetry can answer it, is what finds them. Plus what that telemetry costs, in series and in microseconds.
observabilitydistributed-systemsSep 2026 Networking & media
More samples, same sound
Converting audio to a higher sample rate makes it fit the next program; it cannot bring back sound an earlier step removed. Three test tones show why.
audioperformanceSep 2026
Comments