Observability-driven development
Write the question before the code, and make a test prove the spans can answer it.
On this page · 10 sections
- The dashboard answered the question it was given
- What the dashboard can say
- Put the cart size on the span
- Try the investigation without the useful field
- Why not put it on the dashboard?
- Make the question fail a test
- The questions don’t need to be clever
- What the attributes cost
- Where it stops working
- Run the red test
You run checkout for a small online shop, the kind we’ll keep coming back to in this collection. The service takes a cart, prices it and charges the card, in about 80 ms for a typical order. On Tuesday you ship version 2, which moves pricing into a new pricing service. Checkout still looks healthy: the median is 80 ms before the deploy and 80 ms after it. The slowest 1% of checkouts get a little slower, but nothing on the dashboard suggests a problem.
On Wednesday a wholesale customer opens a ticket. The shop calls each customer account a tenant, and this one is tenant t176. Two of their checkouts on Tuesday were painfully slow, 882 ms and 793 ms. Their carts had 61 and 54 lines, where a typical cart has six.
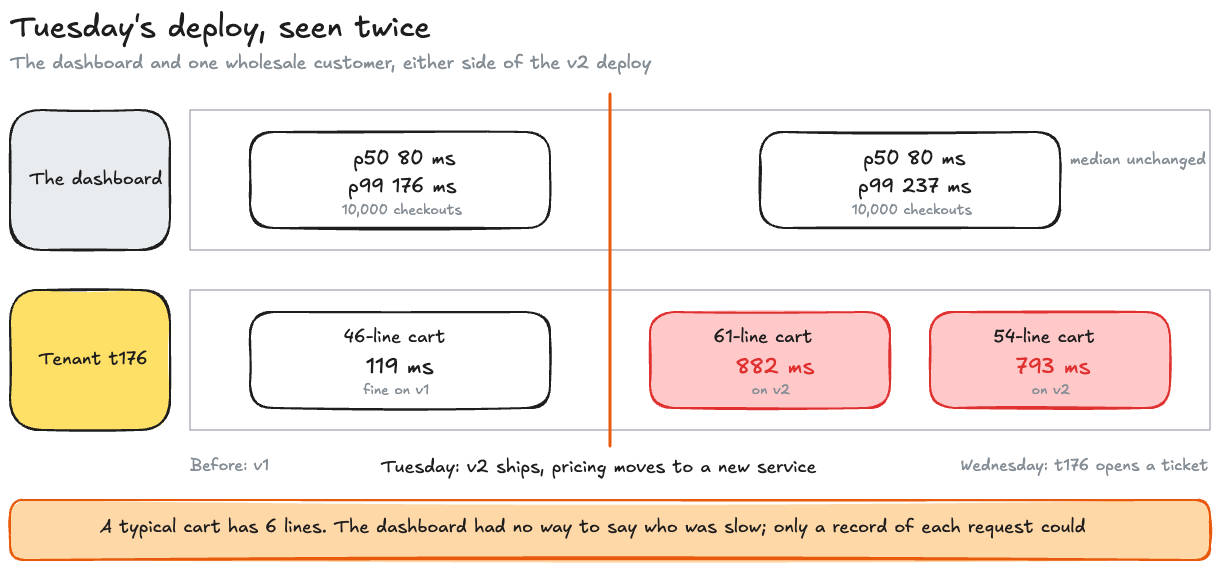
The customer has handed you the most useful clue in the investigation. Whether you can follow it depends on a decision made before Tuesday: did checkout record the size of the cart?
The shop and the incident are a model I built for this post: 20,000 checkouts, split equally between the old and new versions, with a deliberately planted bug. The usual advice is to draw the dashboard before you write the code. I think that has it backwards. Write the question first, and make a test prove your telemetry can answer it.
The short version
- After the deploy, the slowest 1% of checkouts went from 176 ms to 237 ms. The typical one didn’t change at all: 80 ms before, 80 ms after.
- Hidden inside that, 94 requests in 10,000 (0.9%) had gone from fast to a median of 698 ms. Every one was a cart over 40 lines on the new version.
- The dashboard can’t find them, because it only kept totals. A record of each request with the cart size on it finds them in one query.
- Putting cart size or customer on the dashboard instead is expensive. A dashboard stores each metric as separate lines on a graph, one for every combination of its tags. One latency metric is 18 such lines, and 9,000 once it’s tagged with 500 customers.
- So before writing the code, write down the question you’d ask if it broke, and add a test that fails until each request’s record can answer it. A record carrying 10 such details costs 11 to 12 µs to make, against an 80 ms checkout.
The dashboard answered the question it was given
A dashboard is a set of questions chosen in advance. How many requests? How many errors? What does the latency distribution look like? Those are useful questions, and I want their answers visible.
It works like the summary line of a CI run. “412 passed, 1 failed” answers the question the pipeline was built to ask. To learn why the one test failed, you open the build log, and the log can only tell you what the test printed. If the test never printed the input it was given, no amount of reading the log will recover it.
A latency dashboard is the summary line. It’s drawn from metrics: numbers the service adds up as it goes, such as “how many checkouts took between 50 and 75 ms”, and ships every few seconds as totals. Totals are cheap to keep and quick to draw, which is why every service has them. Adding up throws the detail away, though. Charity Majors, co-founder and CTO of Honeycomb, puts it this way: “every dashboard is an answer to a question someone asked at some point”, and with metrics “you stripped away the connective tissue of the event back when you wrote the metrics out to disk” (Notes on the Perfidy of Dashboards).
The build log, in this analogy, is a record of each request: what it was, who sent it, how long it took. It can answer a question nobody thought of in advance, but only from what it wrote down.
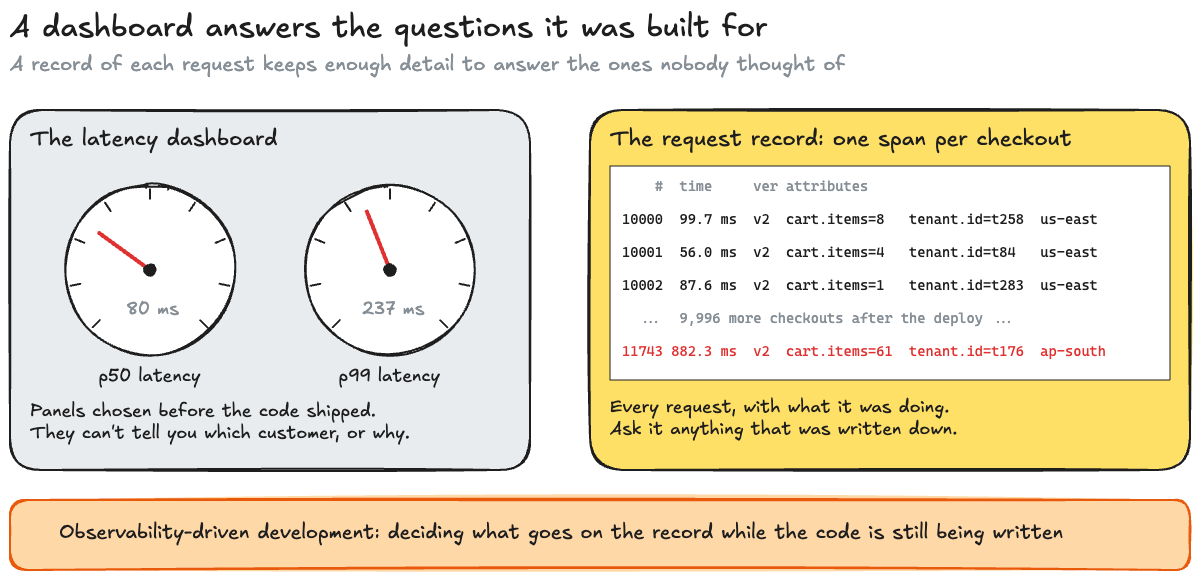
Observability-driven development is the name for deciding what goes on that record while you’re still writing the code. Majors described it as engineers who “understand their software as they write it, include instrumentation when they ship it, then check it regularly to make sure it looks as expected” (Observability: A Manifesto). I like the practice. Most write-ups of it stop at advice, though. I want it to be something a test can check: if the record is missing a field you know you’ll need, the build should fail.
What the dashboard can say
Here’s Tuesday as the shop’s dashboard sees it. The demo runs 20,000 checkouts through the model, 10,000 on v1 and then 10,000 on v2, and records every one into a latency histogram, a metric that counts requests into time ranges called buckets. Each count carries labels, the tags a metric is broken down by. This one is labelled the way the dashboard was drawn, by route and by status code, so every checkout lands under route="/checkout" and status="200". investigate.py reads it back:
== The dashboard: checkout_seconds{route="/checkout", status="200"} before the deploy p50 80 ms p99 176 ms mean 85 ms (10000 requests) after the deploy p50 80 ms p99 237 ms mean 91 ms (10000 requests) ...p50 is the median, the time half of all checkouts beat. p99 is the time 99% beat, so it describes the slowest 1%. The median didn’t move by a millisecond. The p99 rose by 61 ms, the sort of change that gets a “huh” at stand-up and a “probably the new pricing service warming up”. It deserves a look, and it understates what happened to the affected customers. Nothing on this panel says who is slower, and it can’t, because the histogram counted requests into buckets by route and status and kept nothing else.
These are exactly the numbers a dashboard is good at. An ad-targeting system I architected ran at a p50 of 75 ms and a p90 (the time 90% beat) of 150 ms, and numbers like those belong on a wall. They let you spot a broad regression quickly. A percentile across all traffic speaks for everyone at once, however, and a small slice can get much worse inside it while it stays green. Here the slow group is 94 of v2’s 10,000 requests, 0.94%. The p99 is the time 9,900 of them beat, and since fewer than 100 are slow, the p99 still falls among the fast requests, at 237 ms.
The real panel is even calmer than that
Those percentiles come from every request’s exact time, which the demo has and a real dashboard doesn’t. A real panel estimates them from the histogram’s buckets. In prometheus_client, Prometheus’s Python client library and the code the service records them with, the default buckets have fixed edges at 5, 10, 25, 50, 75, 100 and 250 ms and up. Both p99s fall in the same bucket, 100 to 250 ms, and Prometheus’s histogram_quantile assumes requests are spread evenly inside a bucket, so it can only guess where in that range they are. The demo runs the same estimate over each half:
before, as histogram_quantile reads the buckets: p50 81 ms p99 244 msafter, as histogram_quantile reads the buckets: p50 81 ms p99 250 msOn the panel, the slowest 1% got 6 ms slower. Prometheus’s docs walk through this kind of error in Errors of quantile estimation. Buckets that fit your latencies improve the estimate. No choice of buckets would add the missing “who”.
The useful next question is more specific: which checkouts got slower after the pricing change? To answer it, we need a record of each request.
Put the cart size on the span
The record of one request’s path through a system is a trace. A trace is made of spans, and OpenTelemetry, the vendor-neutral standard for this kind of telemetry, defines one in a sentence: “A span represents a unit of work or operation” (Traces). Each span has a name, a start and an end, and attributes: “key-value pairs that contain metadata that you can use to annotate a Span to carry information about the operation it is tracking” (Attributes). In the shop, one checkout is one span. Request 11743, for example, is a span named POST /checkout that lasted 882.3 ms and carries the attributes cart.items=61 and tenant.id=t176.
The checkout handler opens one span per request. Here’s what v2 puts on it:
attributes = { "http.request.method": "POST", "http.route": "/checkout", "http.response.status_code": 200, "tenant.id": req.tenant, "customer.region": req.region, "cart.items": req.items, # the line the question asked for}# Set at creation rather than later, so a sampler deciding whether to keep the span can see them.span = self.tracer.start_span("POST /checkout", start_time=start_ns, attributes=self._recorded(attributes))Here is what request 11743’s span carries, and where each field comes from:
| Field | Value on request 11743 | Named by | Where it lives |
|---|---|---|---|
http.request.method | POST | OpenTelemetry | the span |
http.route | /checkout | OpenTelemetry | the span |
http.response.status_code | 200 | OpenTelemetry | the span |
tenant.id | t176 | the shop | the span |
customer.region | ap-south | the shop | the span |
cart.items | 61 | the shop | the span |
service.version | v2 | OpenTelemetry | the resource |
The first three names come from OpenTelemetry’s semantic conventions, so any tool knows what they mean. The next three are the shop’s own.
The version isn’t in the handler’s code at all. It describes the running process rather than the request, so OpenTelemetry puts it on the resource, the description of the service that’s attached to every span it sends. Every span v2 emits carries service.version=v2 that way.
The code comment is about the sampler, the part of the tracing library that decides which spans to keep. A sampler that decides as the span starts can only use the attributes that are there at that moment. One that can see cart.items could, for example, keep every cart over 40 lines and only one in ten of the rest. That’s why the handler passes the attributes to start_span rather than setting them afterwards.
What the demo's _recorded helper and explicit start times are for
_recorded lets the demo switch attributes off, which gives the test and the lab a way to represent instrumentation that never included cart size. The span’s start and end are passed in because the latency in the demo is a model: nothing sleeps, so each span’s duration is exactly its request’s modelled time. The spans themselves are real objects from the OpenTelemetry Python SDK.
With a span per request, Wednesday’s ticket becomes a query. Take every checkout over 500 ms since the deploy, and count them by each attribute:
== The spans: 94 requests over 500 ms after the deploy, of 10000 by service.version: v1 0, v2 94 cart.items 1-10: 0 slow of 7748 cart.items 11-20: 0 slow of 1627 cart.items 21-40: 0 slow of 531 cart.items 41-80: 85 slow of 85 cart.items 81+: 9 slow of 9 by tenant.id: 82 different tenants, the most any one has is 3 (t165) by customer.region: ap-south 23, eu-west 21, us-east 28, us-west 22Every slow request is on v2. Every one is a cart over 40 lines, and every v2 cart over 40 lines is slow, while no smaller v2 cart is. Customer and region are noise. The 94 are spread across 82 tenants and all four regions, so t176 isn’t experiencing a tenant-specific problem. They happen to buy enough things to trigger it. Pull that slice out and look at it on its own:
== The slice: v2 with more than 40 items: 94 of 10000 requests, 0.9% p50 698 ms p99 1527 ms requests over 500 ms with more than 40 items: 94 of 94 everyone else on v2: p50 80 ms p99 173 ms one of them: tenant t176, 61 items, 882 ms0.9% of checkouts went to a median of 698 ms, where carts that size take about 120 ms on v1, and the other 99.1% stayed at 80 ms. That’s why the dashboard barely moved: 94 requests in 10,000 are too few to shift a median and only just enough to nudge a p99.
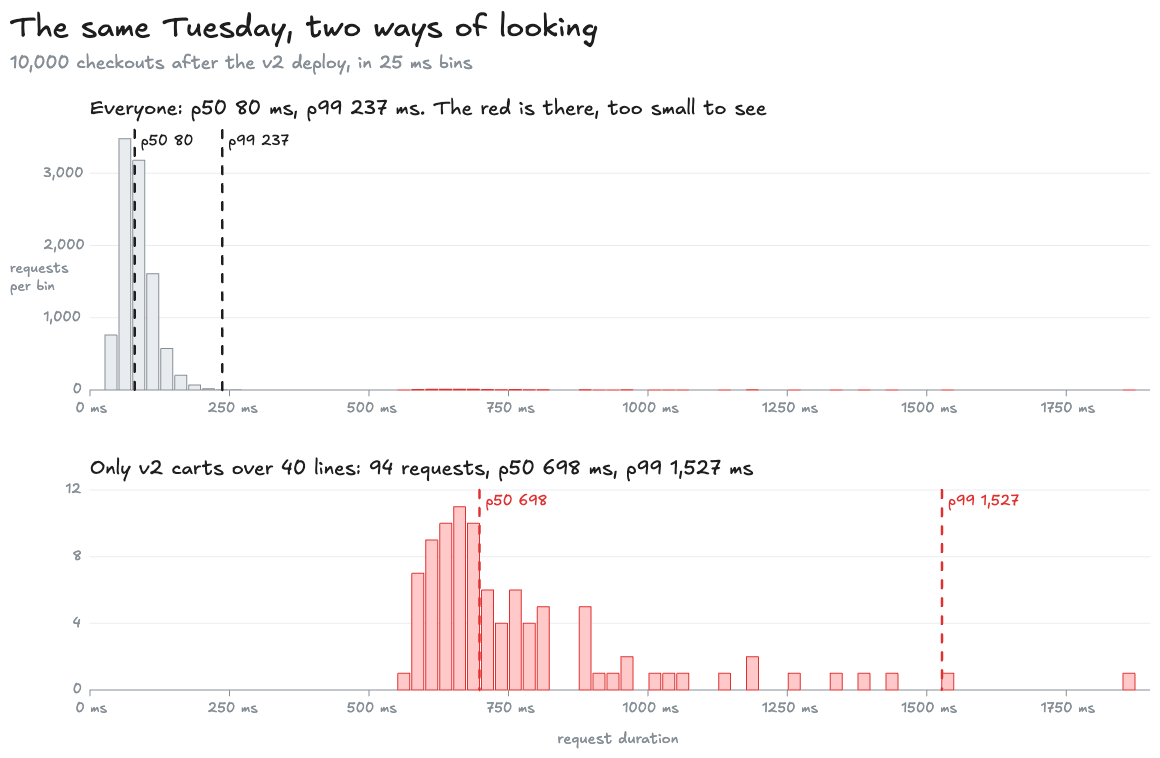
The cause is a line of arithmetic away. Every slow cart is over 40 lines and nothing at 40 or under is slow, which points straight at a limit of 40. In the model, that’s what it is. The new pricing service takes at most 40 lines per call, and v2 falls back to one call per line above that, at 12 ms each. A 61-line cart makes 61 calls, which adds ms to its checkout.
I planted that bug, and I planted the attribute that finds it, so this is hardly a test of investigative skill. Any tool that can group spans by an attribute finds this in one query, and the good ones will rank the attributes for you. The part worth testing is that cart.items was on the span before anyone knew they needed it. Without it, no query helps.
Try the investigation without the useful field
The lab below uses the same 20,000 spans. It opens where you were on Wednesday morning, with only what the spans carried before the question was written: service.version and tenant.id, the same span the red test fails on further down. Group the slow requests by each attribute you have, then tick cart.items, and watch what you can say before and after.
This lab runs a real call in your browser, so it needs JavaScript.
Group the 94 slow requests by service.version first. All 94 are on v2, which tells you when it started, and the best you can say is “v2 is slow for someone”. Group by tenant.id and they’re spread over 82 tenants, no more than 3 each, so the customer who wrote in isn’t special, and nothing recorded says what is.
Now tick cart.items and group by it. The lab counts both versions here, where the output above counted v2 only. Every slow request had a cart over 40 lines, but only 94 of the 173 carts over 40 lines were slow, because the rest ran on v1. Then choose version and cart.items, the grouping that appears once both are recorded: 94 slow of 94, and nothing else slow. Grouping by the two together is what turns a hint into an answer. One record carrying many attributes can be grouped by any combination of them, and separate metrics can’t. Untick everything and the lab falls back to what the dashboard showed.
Ticking cart.items in the lab brings back a field that was there all along. A real omission is less forgiving. Switching it on after the incident won’t put it on yesterday’s spans. You might reconstruct it from another record, if one exists and can be joined, but no query against these spans can recover a cart size that was never recorded.
Why not put it on the dashboard?
If cart size and customer are what Wednesday needed, why not add them to the dashboard’s histogram as labels? Because of cardinality, the number of distinct label combinations a metric has. Prometheus, a widely used open-source metrics system, says it directly: “every unique combination of key-value label pairs represents a new time series” (Naming). A time series is one line on a graph, stored and indexed on its own, and series are what metrics systems are sized and billed by. The dashboard’s histogram has one combination, route="/checkout" with status="200". Add a tenant label and every tenant who checks out adds another: t176 is one, t165 another, up to 500.
A histogram isn’t one series per combination, either. series_cost.py counts what prometheus_client 0.26.0 actually writes:
one histogram, one label set (route, status): 18 series checkout_seconds_bucket x15, checkout_seconds_count x1, checkout_seconds_sum x1, checkout_seconds_created x1the same histogram with a tenant label, 500 tenants: 9000 seriesa counter, one label set: 2 series (checkouts_total, checkouts_created)Fifteen buckets (fourteen with an upper edge, plus +Inf), a count, a sum, and a creation timestamp that this library writes and some others don’t: 18 series for one route and one status. A tenant label with 500 values makes it , for one metric on one process. Every process that exposes the metric writes its own copy, so 20 pods would make it 180,000. Prometheus’s guidance is to “try to keep the cardinality of your metrics below 10”, and for a metric over 100 to “investigate alternate solutions” (Instrumentation). That’s design guidance, not a hard capacity limit.
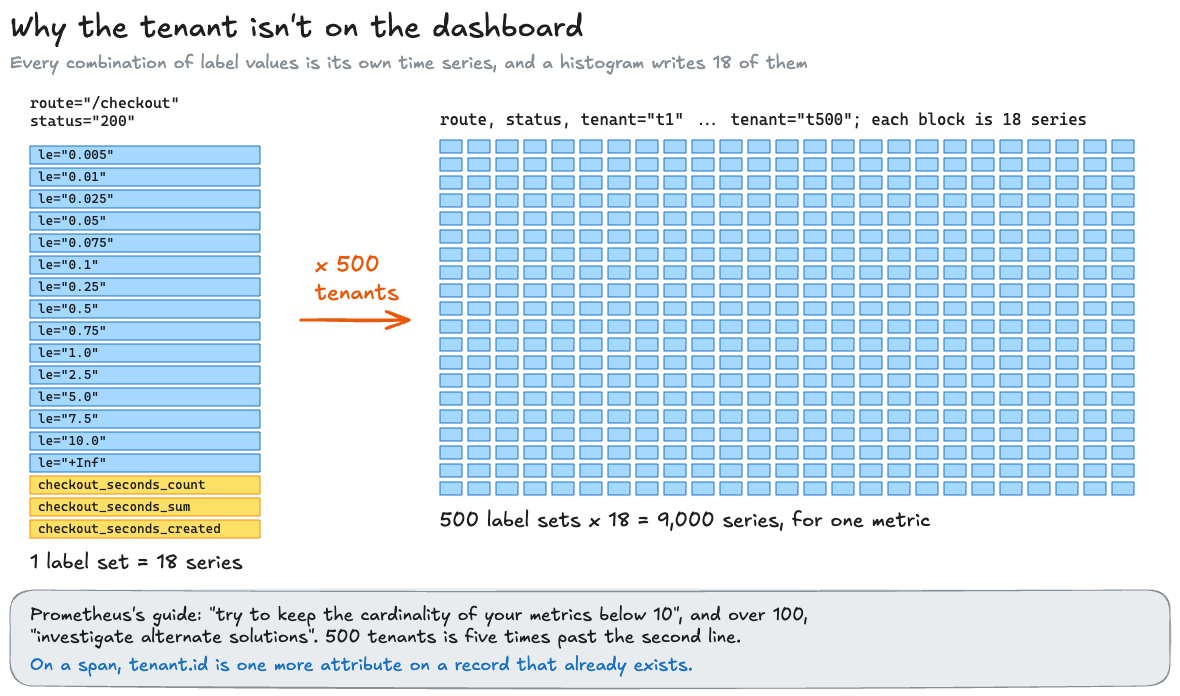
Cart size is no better as a label, and the two together are worse, because labels multiply each other. That’s the asymmetry the rest of this rests on:
| Compared | A metric label | A span attribute |
|---|---|---|
What adding tenant.id with 500 values does | Multiplies every series: 18 becomes 9,000 | Adds one field to each checkout’s span |
What adding cart.items as well does | Multiplies again, by every cart size seen | Adds one more field |
| What the cost grows with | The number of value combinations | The number of attributes, and the spans you keep |
| What it can answer | The questions it was labelled for | Any grouping of the fields it carries |
So I keep on metrics the few numbers I know I’ll always want, and put the detail for questions I can’t predict on spans. The detail still has a cost on a span, because the backend has to ingest, store and possibly index those values. That cost grows with what you keep, not with the number of combinations.
There is a middle road, and it’s worth knowing because it’s cheap. In Amazon’s Builders’ Library, David Yanacek describes a latency metric split by request size: “if there is an operation that can be slower depending on the input size or response size, we consider emitting a latency metric that is categorized, like SmallRequestLatency and LargeRequestLatency” (Instrumenting distributed systems for operational visibility). Two size categories double the histogram, from 18 series to 36, rather than multiplying it by every cart size. On Tuesday, such a metric would have shown the regression only if the line between small and large sat near 40, and nobody knew about 40 until the spans showed it. A bounded metric like that is worth adding once you know where the boundary is. Finding it took the spans.
This is the multiplication I’ve seen people miss most often, and always in the same direction. They count a histogram as one series, forget that every pod exposing it multiplies the total again, and add a label “just for this one dashboard”. The Metric cardinality calculator below does the multiplication. Choose the sample Add a tenant label and press Run. It leads with 9,000 series and the multiplication behind it. Then it charts and lists each change on its own, fewest series first: without the tenant label it’s 18; as a native histogram, which carries all its buckets in one series, it’s 500; without _created it’s 8,500. Below that, Label sets reads 500 and is flagged against the Prometheus guidance quoted above. Then put in your own metric’s labels and how many values each takes, its type and client library, and under Targets how many processes expose it:
Make the question fail a test
So cart.items has to be on the span before Tuesday. It doesn’t get there by luck, or by recording everything anyone could think of. It gets there because, before writing v2’s pricing change, you write down the question you’d ask if the change went wrong:
If checkout gets slower after the pricing change, which carts is it slower for, and on which version?
The Builders’ Library article makes the same point from the support side. Yanacek’s advice is to include “enough metadata about the request so we can later determine whom the request was from and what the request was attempting to do”, and he adds: “This includes metadata that a customer would expect us to have in our log when they reach out with problems.” Wednesday’s ticket is exactly that moment.
The question needs two fields, a numeric cart size and a service version. Then you write a test that fails unless the span can answer it. It isn’t a test of the pricing. It’s a test of the telemetry:
QUESTION = "If checkout gets slower after the pricing change, which carts is it slower for, and on which version?"NEEDS = {"cart.items": int, "service.version": str}
# ...
def assert_can_answer(span) -> None: fields = {**span.resource.attributes, **span.attributes} missing = [k for k in NEEDS if k not in fields] assert not missing, f"the span can't answer {QUESTION!r}: it has no {', '.join(missing)}" for key, kind in NEEDS.items(): assert isinstance(fields[key], kind), f"{key} is {type(fields[key]).__name__}, and a query needs {kind.__name__}"The test runs the real handler once, with a 61-line cart from t176, and catches the span with OpenTelemetry’s in-memory exporter. An exporter is the piece that sends finished spans somewhere, and this one keeps them in a list, so the test checks the telemetry the handler actually emitted rather than a dictionary production might never use. It checks two things. Every field the question needs is there, on the span or on its resource. And each has a type a query can group by: a cart size sent as the string "61" would pass a presence check and fail every “more than 40” query, so the type is part of the contract.
Before the question was written, the span carried the version and the tenant, which is what support tickets are filed under. Run against that, the test fails, and says why:
E AssertionError: the span can't answer 'If checkout gets slower after the pricing change, which carts is it slower for, and on which version?': it has no cart.itemsE assert not ['cart.items']FAILED tests/test_question_first.py::test_red_step - AssertionError: the span...1 failed, 3 passed in 0.07sThe failure names the question and the missing field, which is the message you want a colleague to see in CI. The fix is the one line with the comment on it in the handler. Then the test passes, the pricing change gets written, and it ships with the attribute that will find its bug. In the companion code the failing version is kept as a test marked “expected to fail”, so CI shows the red step, as test-driven development calls the failing test written before the code, without going red itself.
A question about production becomes a requirement on what the code emits.
This is a small contract. It doesn’t prove the count is correct, that every production path sets it, or that the collector will deliver it. Tests for those properties can go further. What this one removes is the entirely avoidable failure of shipping a handler that can’t emit the field at all.
The questions don’t need to be clever
If that looks like test-driven development, it is, pointed at a different output. It’s also where I part company with the name. Jessica Kerr, also at Honeycomb, objects to it: “I don’t want observability to drive your development.” Her alternative is a question: “For each feature, start with: ‘How will I know it works?’ Tests can answer this question at small scales in controlled environments. Only observability can answer it in production, in every scenario encountered by real customers.” (What Observability-Driven Development Is Not). I agree with her, and the test above is my answer to her question. The question about production gets asked at design time, and a test in the suite makes sure production will be able to answer it.
This is how I’ve come to work on anything other people depend on. When I design a service, I write down the two or three questions I’d ask on the day it misbehaves, and each one becomes a field the telemetry has to carry. On a real-time media platform I rebuilt, a 50 ms real-time target was guarded by a p99 regression gate, a check that fails when the slowest 1% gets slower. That check tested a performance boundary. An attribute test moves one step earlier: it checks that we’ll have the information to investigate a boundary we miss.
The questions are rarely clever. Which version? Which customer, on which plan? How big was the input? Which dependency did we call, and did we retry? The mistake I see most isn’t a missing exotic field. The developer knew the input size while handling the request, and nobody made keeping it part of finishing the feature.
What the attributes cost
There are two currencies: series for metrics, which we’ve seen, and time for spans. series_cost.py creates and ends spans through the real SDK, passing the attributes at creation as the handler does. It uses the batching processor a production service would use, which queues finished spans and hands them to the exporter in batches, and an exporter that throws everything away. So it measures the cost inside the service, not the cost of sending the data anywhere. Best of 5 runs of 50,000 spans, on a laptop with Python 3.13:
one span, created and ended, best of 5 x 50,000, on Darwin arm64: 0 attributes: 7.7 µs 4 attributes: 9.9 µs 10 attributes: 11.4 µsA span with 10 attributes takes 11 to 12 µs to make: 11.4 µs in the recorded run, and between 10.7 and 12.4 µs in two later runs on the same laptop. Against a checkout whose median is 80 ms, that’s at most , under 0.02%. An empty span is about 8 µs, so the 10 attributes add under 4 µs, roughly 0.4 µs each. That’s enough to dismiss “the extra integer will make checkout slow” as a reason for leaving out cart size here. It isn’t a forecast for every SDK, attribute value or exporter.
The costs this benchmark leaves out
The expensive part of tracing isn’t creating spans. It’s sending, storing and indexing them. That’s measured in your backend’s bill, not in microseconds, which is why this demo doesn’t pretend to measure it. Two things decide it: how many spans you keep, and for how long.
Sampling, keeping only some traces, is the usual lever, and it’s why OpenTelemetry’s docs say to “Prefer adding attributes at span creation to make the attributes available to SDK sampling” (Attributes). The sampling policy still has to keep the evidence your questions depend on.
The other cost is the one we’ve been avoiding: a field with many possible values turned into a metric label.
Where it stops working
The limit is the one the lab shows, and it’s the build log’s: you can read only what the test printed. You only find what you recorded. The test makes sure the attributes you chose are actually emitted, with the right types, on every release. It can’t choose them for you, and it can’t help with the question nobody thought to write down.
That’s the strongest argument for recording more than the questions strictly need. If each request’s record carries dozens of fields rather than five, the unasked question has a better chance of being answerable anyway. The usual name for that is wide events, one rich record per request. The shop’s span is a narrow one, six attributes and a resource; a wide one would add the plan, the payment method, the pricing calls and their retries. Majors makes the case for “a wide structured data blob per request” in the same post on dashboards.
So I treat the written questions as a floor, not a ceiling. The test guarantees the floor. Everything cheap and obviously useful, such as the version, the customer, the size of the input and which dependencies were called, goes on the span too, whether or not a question asked for it. At about 0.4 µs an attribute, the cost of recording them is small next to the cost of not having them on the day you need them.
Testing the whole trace, not one span
The test here checks one service’s span in a unit test. Trace-based testing does the same check at the system level: send a request through the deployed services and assert on the trace that comes back, for example that the pricing call carries the line count, or that no checkout makes more than one pricing call. Tracetest is one tool for it. It catches what a unit test can’t, such as an attribute set in one service and lost at the next hop, or an unexpected downstream call. It needs the relevant services running and a trace to arrive, so it sits at a different point in the test suite.
The same argument, now that more code arrives faster
The second edition of Observability Engineering, by Majors, Liz Fong-Jones and George Miranda with Austin Parker, came out in June 2026, and it’s pitched at exactly this. In Honeycomb’s announcement, Majors says: “Most teams are shipping faster than ever, accelerated by AI, yet their production feedback loops haven’t kept pace.”
If more of the code arrives written by a model, the person reviewing it may understand it less well than its author would have, and the questions about how it behaves in production matter more, not less. The contract doesn’t care who wrote the handler. It asks the same question of code written by a person, generated by a model, or changed by both: will the resulting request record support the investigation?
Run the red test
Everything above is in observability-driven/. shop/checkout.py is the service with its spans and its histogram. investigate.py prints Tuesday twice, as the dashboard and as the spans. tests/test_question_first.py is the question and its test. series_cost.py counts series and times spans, and export_runs.py writes the counts the lab draws.
cd mainlog-code/observability-drivenpython -m venv .venv && .venv/bin/pip install -r requirements.txt.venv/bin/python investigate.py # the dashboard view, then the span view.venv/bin/python series_cost.py # about 10 seconds; --series skips the timing.venv/bin/python -m pytest -q tests -rx # 3 passed, 1 xfailed: the red step.venv/bin/python -m pytest -q tests --runxfail # the red step, failing with its messageIts CI runs the tests, checks that the red step fails for the reason above, and checks a few of the headline numbers quoted here. The span timing is printed but not checked, because it moves with the machine.
So you find the 94 slow checkouts on Wednesday morning, because a question written the week before put the cart size on every span. The part worth borrowing is small enough to fit in a feature review: write the question, name the fields, and make the handler prove it emits them.
The next problem for the shop is less subtle. More checkouts arrive than its workers can finish. The records can tell us who is waiting, but the queue still needs a policy for what to do with them.
Related posts
Backpressure and load shedding
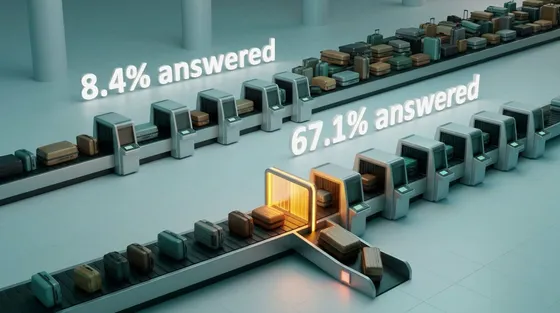
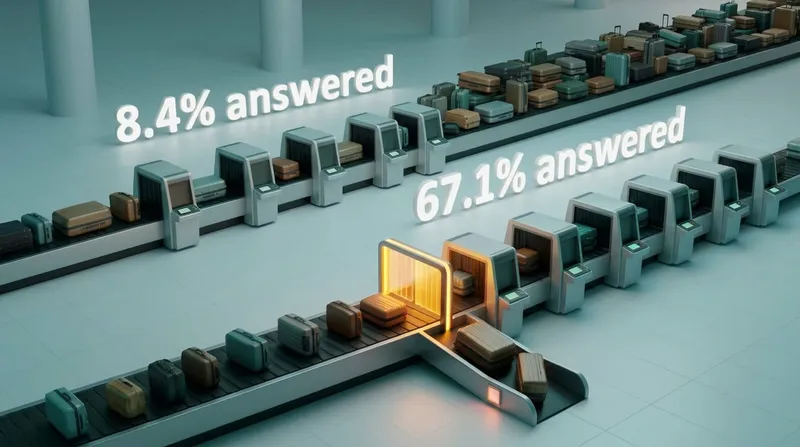
A shop's checkout service can answer 100 requests a second, and for one minute 150 arrive. Left at the usual default, it answers 8% of those people in time; refusing the overflow at once answers two thirds. Capacity decides how many can be served. The policy decides whether they are, and only the question of who is a product decision.
Down to the wiredistributed-systemsreliabilityperformance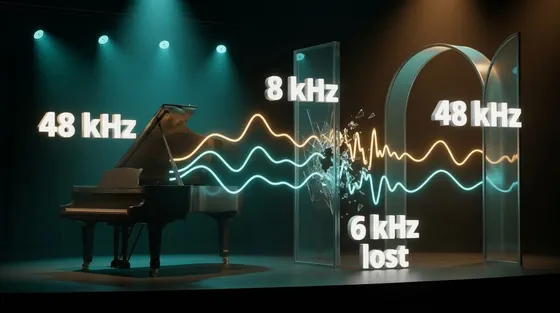
More samples, same sound
Converting audio to a higher sample rate makes it fit the next program; it cannot bring back sound an earlier step removed. Three test tones show why.
Down to the wireaudioperformance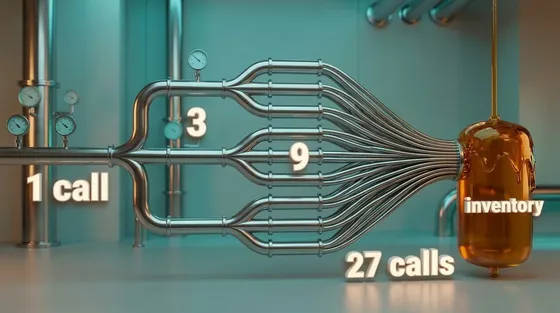
What a service mesh costs
Your shop now runs 14 services in three languages, and security wants every call between them encrypted and identified. A mesh does that without touching the code, for about a fifth of a millisecond per hop and a tenth of a core per proxy per 1,000 requests a second, measured here with real Envoy. It also brings retry and queue defaults nobody chose. Over plain HTTP they retry less than most people expect; over gRPC, or after one common edit, a failing service gets 27 calls for one checkout.
Down to the wireinfrastructuremicroservicesnetworking
 Systems
Backpressure and load shedding
A shop's checkout service can answer 100 requests a second, and for one minute 150 arrive. Left at the usual default, it answers 8% of those people in time; refusing the overflow at once answers two thirds. Capacity decides how many can be served. The policy decides whether they are, and only the question of who is a product decision.
distributed-systemsreliabilitySep 2026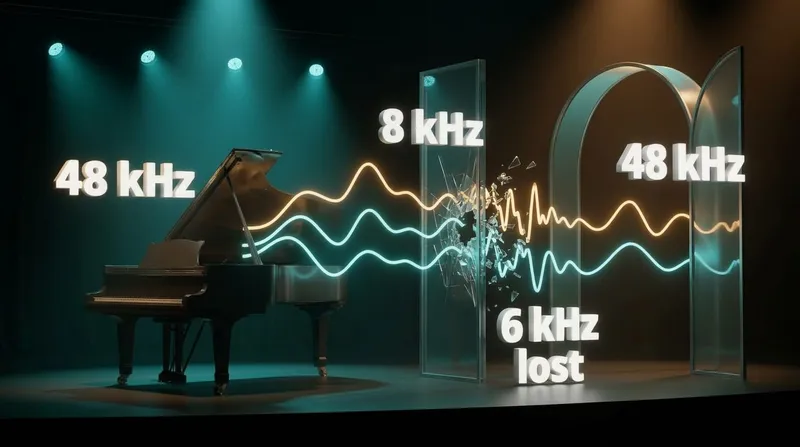 Networking & media
More samples, same sound
Converting audio to a higher sample rate makes it fit the next program; it cannot bring back sound an earlier step removed. Three test tones show why.
audioperformanceSep 2026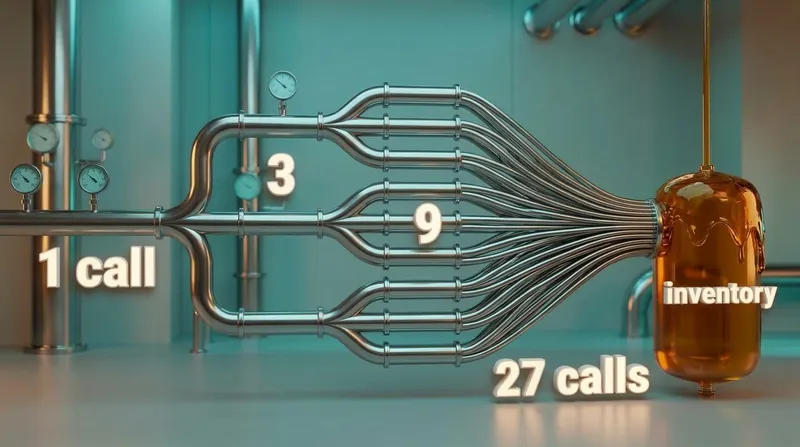 Systems
What a service mesh costs
Your shop now runs 14 services in three languages, and security wants every call between them encrypted and identified. A mesh does that without touching the code, for about a fifth of a millisecond per hop and a tenth of a core per proxy per 1,000 requests a second, measured here with real Envoy. It also brings retry and queue defaults nobody chose. Over plain HTTP they retry less than most people expect; over gRPC, or after one common edit, a failing service gets 27 calls for one checkout.
infrastructuremicroservicesOct 2026
Comments