What a service mesh costs
About a fifth of a millisecond per hop, and a set of retry and timeout defaults worth reading first.
Your shop from the observability post now has 14 services, written in Go, Python and Java by four teams. A checkout passes through four of them in a row: the frontend calls checkout, checkout calls pricing, and pricing calls inventory to see what’s in stock.
Then the security review lands. It asks for three things: every call between services encrypted, every service able to prove who it is, and a record of who called whom. Your teams can build that into their applications, or you can make it the platform’s job.
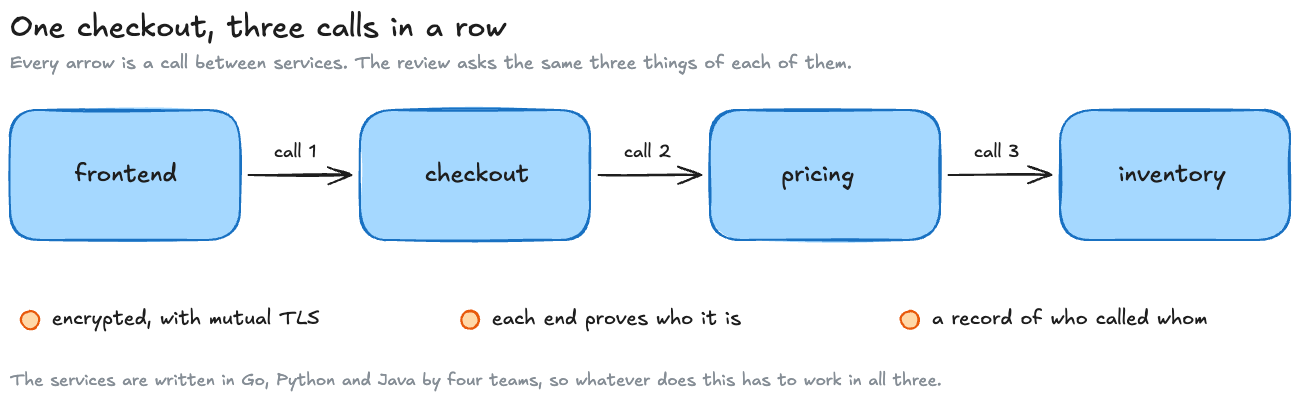
A service mesh makes the second option attractive. It puts a proxy on the path of every call and lets the proxies handle mutual TLS (mTLS, where both ends present a certificate rather than only the server), identity checks and common traffic rules, in every language at once. Your application teams have less plumbing to maintain, though every request now passes through more of it. The two meshes most teams look at are Istio and Linkerd. Istio’s proxy is Envoy, a general-purpose proxy that’s also used on its own; Linkerd has its own proxy.
I’ve built resilience into an application runtime and SDK, and authentication, authorization and auditing into an internal API gateway, so I’ve worked on both sides of that trade. Before choosing a mesh, I want to know two things: what it adds to every call, and what behaviour arrives with its defaults. So I measured the first with Envoy, and followed the second into Istio’s source.
The short version
- The cost is per hop, and the saving is across teams. Identity and traffic rules move out of three language libraries and into the platform.
- Measured with real Envoy proxies, a hop adds about 0.22 ms at the median, and about the same with mTLS. A hop is two proxies, and each uses about 0.11 of a CPU core for every 1,000 requests a second.
- That’s a quiet path with nothing else on it. It isn’t a whole mesh under production load, and because the proxies keep their connections open, it hides most of the cost of setting up TLS.
- Istio’s defaults deserve their own review. They raise Envoy’s limits on queued requests to about 4.3 billion, and set no timeout on HTTP routes.
- Retries multiply only when every layer retries the error it gets. With Istio’s defaults, three calls deep, a failing inventory sees 3 attempts per checkout over plain HTTP when it’s down, and 1 when it answers 503. It’s 27 only over gRPC, or once someone adds 503 to the retry list.
Where the check happens
There are four places to put the work the review asks for. The clearest way to compare them is to follow one call, checkout calling pricing, and ask where its certificate is checked:
| Placement | Where checkout’s call to pricing is checked | What you run |
|---|---|---|
| A library in every service | Inside pricing’s own code, by a library linked into it | One library per language, kept in step |
| An ingress proxy at the front door | Nowhere: the ingress checks requests coming in from outside, and internal calls pass unchecked | One proxy, or a few |
| A sidecar mesh | In a proxy running next to pricing, in the same Kubernetes pod (the unit a copy of a service runs in), which checks the certificate presented by a proxy next to checkout | Two proxies per call, one beside every copy of every service |
| Istio’s ambient mode | In a shared proxy on each machine, called a ztunnel, plus an optional waypoint proxy for rules that need to read the HTTP request itself | One proxy per machine, and waypoints where needed |
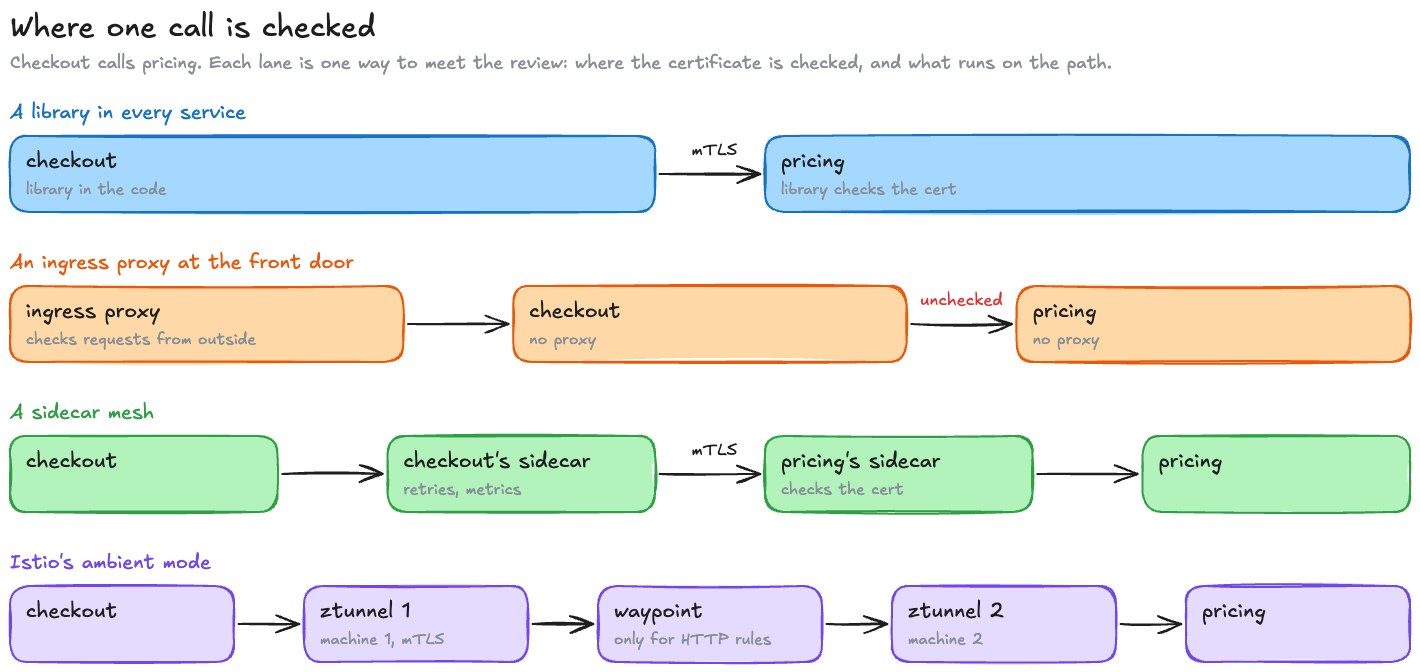
An ingress protects the way into the system, and it doesn’t touch checkout’s internal call to pricing. Your review explicitly includes those internal calls, so a front-door proxy alone doesn’t meet it.
Two more terms are worth having before going on. The proxies that carry the requests are the mesh’s data plane. The component that hands them their configuration and certificates is the control plane: in Istio that’s istiod, which, for example, issues pricing’s proxy a fresh certificate before the old one expires. The control plane isn’t consulted on each request, so it isn’t on the per-call path. It still matters when things change: new configuration, a service’s copies moving, recovery after a failure. Every per-call cost, though, is in the data plane.
First, check what a benchmark measured
Published figures for a mesh’s overhead range from a fraction of a millisecond to hundreds of milliseconds. They aren’t interchangeable, because CPU at a fixed request rate, median latency on an idle path and the slowest requests under heavy load answer different questions. Two of the figures below are p99, the time 99% of requests beat, which describes the slowest 1%:
| Source | Who ran it, and the setup | What it reports |
|---|---|---|
| Istio’s own docs, for Istio 1.24 | Istio. 1,000 requests a second of 1 KB each, 2 worker threads per proxy | A sidecar “consumes about 0.20 vCPU and 60 MB of memory”; a waypoint about 0.25 vCPU and 60 MB; a ztunnel 0.06 vCPU and 12 MB |
| Morgan 2021 | Buoyant, who make Linkerd. Linkerd 2.10.2 and Istio 1.10.0, 20 to 2,000 requests a second | At 20 a second, “Linkerd’s median latency was 17ms, 11ms over the baseline of 6ms”, and Istio’s 26 ms |
| Bremler-Barr et al. 2024 | Researchers at Tel Aviv and Reichman universities with a Red Hat co-author, “partly supported by RedHat Research”. 3,200 requests a second over 1,600 connections, mTLS on, a Go server that waits 200 ms per request | p99 up 166% for Istio’s sidecars, 8% for ambient, 33% for Linkerd and 99% for Cilium. Istio’s sidecars added 0.38 s to a 0.22 s baseline |
So before using any of these numbers, look at who ran the benchmark and how. The vendor comparison uses older versions and its own test setup. The academic result is at a load heavy enough to queue: 1,600 connections, each holding a request open for 200 ms. Neither isolates the work one proxy does on one request. A proxy’s own work is a fraction of a millisecond, so when a benchmark reports tens or hundreds of milliseconds, most of what it measures is waiting under that benchmark’s load. That’s why I wanted a narrower measurement before reasoning about your chain.
The arXiv text and its table don't quite agree
Table I of the report gives its numbers “relatively (+) to the baseline”, with latency in seconds, CPU in cores and memory in MiB. The baseline p99 is 0.22 s, and Istio’s sidecars add 0.38 s, ambient 0.02 s, Linkerd 0.09 s and Cilium 0.22 s. Worked out against that baseline, those are 173%, 9%, 41% and 100%, slightly different from the 166%, 8%, 33% and 99% in the text, which doesn’t say what it measured them against. The report doesn’t give the mesh versions either, only Kubernetes 1.24.6. None of that changes the ordering, but it’s why I quote the text’s figures as the authors’ and the table’s as the table’s.
About a fifth of a millisecond per hop
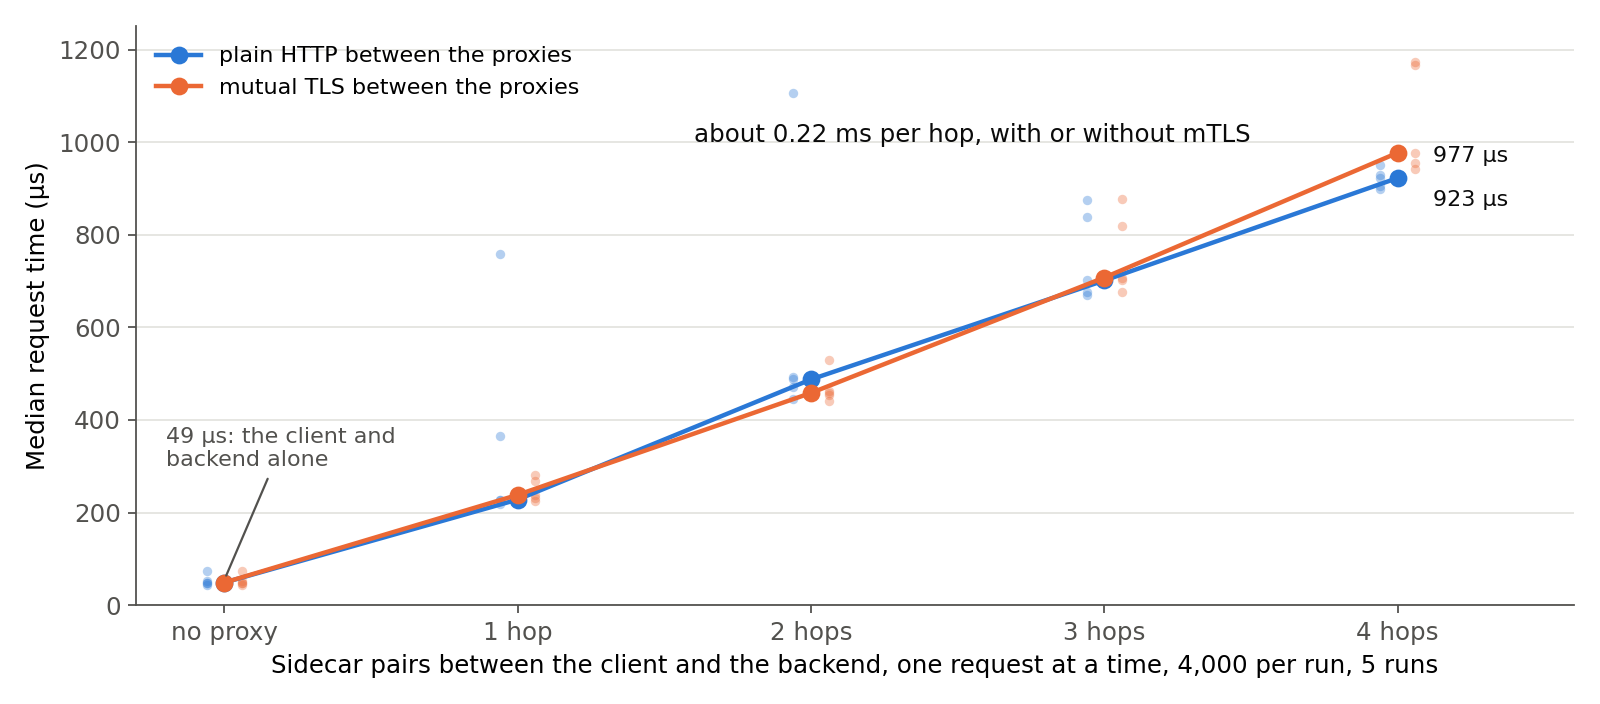
So I measured the floor myself: what one hop costs when nothing else is in the way. All it takes is Envoy, version 1.39.3, on a 12-core Apple M3 Pro laptop that was busy with other work at the time, with a small Python client and backend on the same machine. A hop here is what a sidecar mesh puts on every call: the caller’s proxy, a connection between the proxies, and the callee’s proxy. The demo chains 0 to 4 of them in front of a backend:
client ─▶ [out ─(mTLS)─▶ in] ─▶ [out ─(mTLS)─▶ in] ─▶ ... ─▶ backend (0 to 4 hops)Each proxy gets 2 worker threads, as Istio’s do, and only Envoy’s router: no telemetry, no policy. There are two measurements per configuration, five runs each, interleaved so that a busy minute on the laptop lands on every configuration rather than one:
- Latency: one request at a time on one connection, 4,000 per run, so nothing queues and each request’s time is the path’s own.
- CPU: 1,000 requests a second for 10 seconds, with each proxy’s CPU time read before and after.
| Measured, Envoy 1.39.3 | Plain HTTP between proxies | mTLS between proxies |
|---|---|---|
| Median added per hop | 222 µs | 233 µs |
| 90th percentile added per hop | 353 µs | 403 µs |
| CPU per proxy, per 1,000 requests a second | 0.114 cores | 0.112 cores |
| CPU per hop (two proxies), per 1,000 requests a second | 0.228 cores | 0.224 cores |
| Memory per proxy | 42 to 47 MB | 45 to 49 MB |
From bench_hops.py, medians of five runs. The per-hop figures are the slope of a straight line through 0 to 4 hops.
The five runs agree well enough to trust the medians. The per-hop slope came out between 177 and 237 µs plain, and between 227 and 270 µs with mTLS; the CPU per proxy between 0.09 and 0.17 cores. I’ve reported the 90th percentile rather than the 99th because, on a laptop doing other things, the slowest 1% moved by tens of milliseconds from run to run. That’s the laptop, not the proxies.
Three things in those numbers matter for your shop.
- mTLS is nearly free per request, here. The expensive part of TLS is the handshake, and the proxies keep their connections to each other open, so it happens once per connection rather than once per request. What’s left is encrypting the bytes, which a modern CPU does very quickly. Short-lived connections or much larger payloads would cost more.
- The bare proxy is lighter than Istio’s published sidecar. It uses 0.11 cores per proxy here, against Istio’s 0.20 per sidecar, which is also one proxy. Istio’s sidecars run more than a router: telemetry, policy and the rest of its filter chain. These are different benchmarks, so the gap isn’t a measurement of what those filters cost. Read 0.11 as the floor and 0.20 as closer to what a real mesh costs, per proxy; a hop has two.
- The cost is per hop, so count the hops. Your checkout is three calls deep: three hops, about 0.7 ms at the median. On a checkout that takes 80 ms, that’s under 1%. Put the same three hops in front of a cache lookup that takes 0.5 ms and it becomes about 1.2 ms. The proxies add the same 0.7 ms in both cases, but on the cache lookup it more than doubles the time.
These numbers are for a quiet path. In production the proxies share CPU with your services, and when that CPU is busy, the tail is where the cost shows.
What this measures, and what it doesn't
It’s the proxy, not the mesh. There’s no Kubernetes, no traffic redirection (a sidecar mesh normally uses iptables rules to send a pod’s traffic through its proxy, which adds its own small cost), no control plane and no telemetry. Everything is on one machine, so each “network” hop is a localhost connection, and the client and backend are Python sharing the machine with the proxies. The absolute numbers are this laptop’s; the differences between hop counts are the proxies’. To know what it costs you, measure your real path at the load and the CPU limits you intend to run.
What it saves, per team
The cost is per hop. The benefit is per team, and it’s the reason meshes exist.
Without a mesh, mTLS, identity, retries and metrics are code in every service. In one language that’s a shared library, and it works: Twitter’s Finagle and Netflix’s Hystrix were libraries of exactly that kind, for the JVM. I’ve built that layer into a platform myself. On a third-party application platform I architected, retries, timeouts, fail-fast circuit breakers and bulkheads were part of the runtime and SDK the integrations ran on. When the runtime is yours, that’s a reasonable home for them.
Your shop has three languages and four teams, though. That’s three libraries, kept in step by three teams, and every upgrade, such as a new certificate rotation scheme, is a change and a deploy in all 14 services.
A mesh makes that one change in the proxies, and the services never see it. That includes the services nobody has touched in a year. It doesn’t remove every application responsibility: passing trace context along, deciding what a caller is allowed to do, and knowing whether an operation is safe to retry can still need application code. What you’re buying with the 0.2 ms is the review’s three requests met by the platform team, in every language. Someone still has to own the platform.
The defaults you didn’t choose
Latency is the part everyone measures. The part I’d read first is the configuration a mesh applies to every call before you’ve written any.
Envoy has what it calls circuit breakers, though they aren’t the kind that trips after a run of failures. They’re caps on how much may be in flight to each service, an upstream in Envoy’s terms, at once. Here are Envoy’s caps, each the value used “If not specified” (Envoy docs), beside the values Istio generates (source at 1.31.1):
| Per upstream, at most | Envoy’s default | Istio 1.31.1 |
|---|---|---|
| Connections | 1,024 | 4,294,967,295 |
| Requests waiting for a connection | 1,024 | 4,294,967,295 |
| Requests in flight | 1,024 | 4,294,967,295 |
| Retries in progress at once | 3 | 4,294,967,295 |
Envoy’s documentation is clear about why its caps exist: “It’s nearly always better to fail quickly and apply back pressure downstream as soon as possible” (circuit breaking). In Envoy’s terms downstream is the caller, so this means refusing work early and letting the caller know. Istio’s 4,294,967,295 is the largest number the field can hold, so in practice there’s no cap. It gives its reason in the code, and it’s a fair one:
// DefaultMaxRetries specifies the default for the Envoy circuit breaker parameter max_retries. This// defines the maximum number of parallel retries a given Envoy will allow to the upstream cluster. Envoy defaults// this value to 3, however that has shown to be insufficient during periods of pod churn (e.g. rolling updates),// where multiple endpoints in a cluster are terminated. In these scenarios the circuit breaker can kick// in before Pilot is able to deliver an updated endpoint list to Envoy, leading to client-facing 503s.MaxRetries: &wrapperspb.UInt32Value{Value: math.MaxUint32},MaxRequests: &wrapperspb.UInt32Value{Value: math.MaxUint32},MaxConnections: &wrapperspb.UInt32Value{Value: math.MaxUint32},MaxPendingRequests: &wrapperspb.UInt32Value{Value: math.MaxUint32},// ...Pilot is the old name for istiod, the control plane. During a rolling deploy, when old copies of a service are being stopped and new ones started, and while istiod catches up with which copies of a service still exist, a cap of 3 retries in flight was turning brief gaps into errors for users, so Istio removed the cap. That explains the choice. It doesn’t make “no limit” right for every service. In the backpressure post, your checkout ran 8 workers and could answer about 100 requests a second, and no proxy setting changes how many it can serve. It only changes how many are left waiting.
Then there are two more defaults to read together. Calls are retried twice: “The default retry behavior for HTTP requests is to retry twice before returning the error.” And there’s no timeout: “The Envoy timeout for HTTP requests is disabled in Istio by default” (traffic management). Other layers can still impose their own deadlines, but the route itself has none. Linkerd, for comparison, retries only when you configure retries on a Service or a route, and then “If unspecified, the default is 1” (Linkerd retries, for Linkerd 2.20).
The missing timeout goes against the oldest advice on the subject. Marc Brooker’s article on timeouts and retries in the Amazon Builders’ Library puts it plainly: “A best practice in Amazon is to set a timeout on any remote call, and generally on any call across processes even on the same box” (Timeouts, retries, and backoff with jitter).
Which failures do Istio’s two retries cover? Fewer than “retry twice” suggests. Its default list is connection failures, an HTTP/2 stream the server refused before starting it, and gRPC’s UNAVAILABLE and CANCELLED: the “couldn’t get through” errors. It doesn’t retry an HTTP 503, and it doesn’t retry a slow response, as we’ll see. So in the language of the backpressure post, Istio’s defaults give you no limit on how many requests may wait and none on how long. That post’s sale, where 150 requests a second arrived for a minute at a service that could answer 100, never recovered when unlimited waiting met retries, and this is the first half of that combination. The other half is retries that fire on slow responses, and those come from your app’s own client, or from a retry policy someone widened.
Would Envoy's 1,024 be any better?
Not automatically, and it’s two queues, not one. The 1,024 pending requests wait inside Envoy for a connection to the service, and they only start to queue once the 1,024 connections (for HTTP/1.1) or 1,024 requests in flight (for HTTP/2) are all in use. Those in-flight requests are already at the service, queued there. So up to 2,048 requests can be waiting before anything is refused. At your checkout’s 100 requests a second, 1,024 alone is 10 seconds of queue, five times the app’s 2-second timeout, and in the backpressure post a queue that long answered no more people than no limit at all. A limit on waiting requests is really a limit on waiting time, the number divided by how fast they’re served, and only you know those two numbers.
When retries multiply
In a sidecar mesh every caller’s proxy retries, and your checkout is a chain. Suppose inventory fails, and each proxy retries what it gets. Pricing’s proxy tries inventory 3 times, the first call and two retries. Checkout’s proxy sees pricing fail and tries pricing 3 times, each of which tries inventory 3 times. Frontend’s proxy does the same to checkout. That’s calls toward inventory for one checkout.
Whether a real mesh does that depends on the error that travels back up the chain, so I ran it. The demo puts three Envoy proxies in a row, frontend’s, checkout’s and pricing’s, each with Istio’s default retry policy copied from its source (retry.go at 1.31.1):
defaultNumRetries = &wrappers.UInt32Value{Value: 2}defaultRetryOn = "connect-failure,refused-stream,unavailable,cancelled,retriable-status-codes"The demo turns that into Envoy configuration, with Istio’s raised circuit breakers alongside:
ISTIO_RETRY_ON = "connect-failure,refused-stream,unavailable,cancelled,retriable-status-codes"
def retry_policy(retry_on: str = ISTIO_RETRY_ON, status_codes: list[int] | None = None, num: int = 2) -> dict: policy = { "retry_on": retry_on, "num_retries": num, # ... } if status_codes: policy["retriable_status_codes"] = status_codes return policyEach proxy gets that policy on its route. The elided part is Istio’s rule for trying a different copy of the service on each retry. Then inventory fails three ways, and the 503 case gets two variations:
| Inventory… | Attempts toward inventory, per checkout |
|---|---|
| is down, and the calls are plain HTTP | 3 |
| is up, but answers every request with a 503 | 1 |
| is down, and the calls are gRPC | 27 |
| answers 503, and 503 has been added to the retry policy | 27 |
| the same, with the app also retrying the whole checkout twice | 81 |
From retry_chain.py: 20 checkouts each, counted by the proxies and by inventory itself. When inventory is down, these are connection attempts toward it, not requests it received.
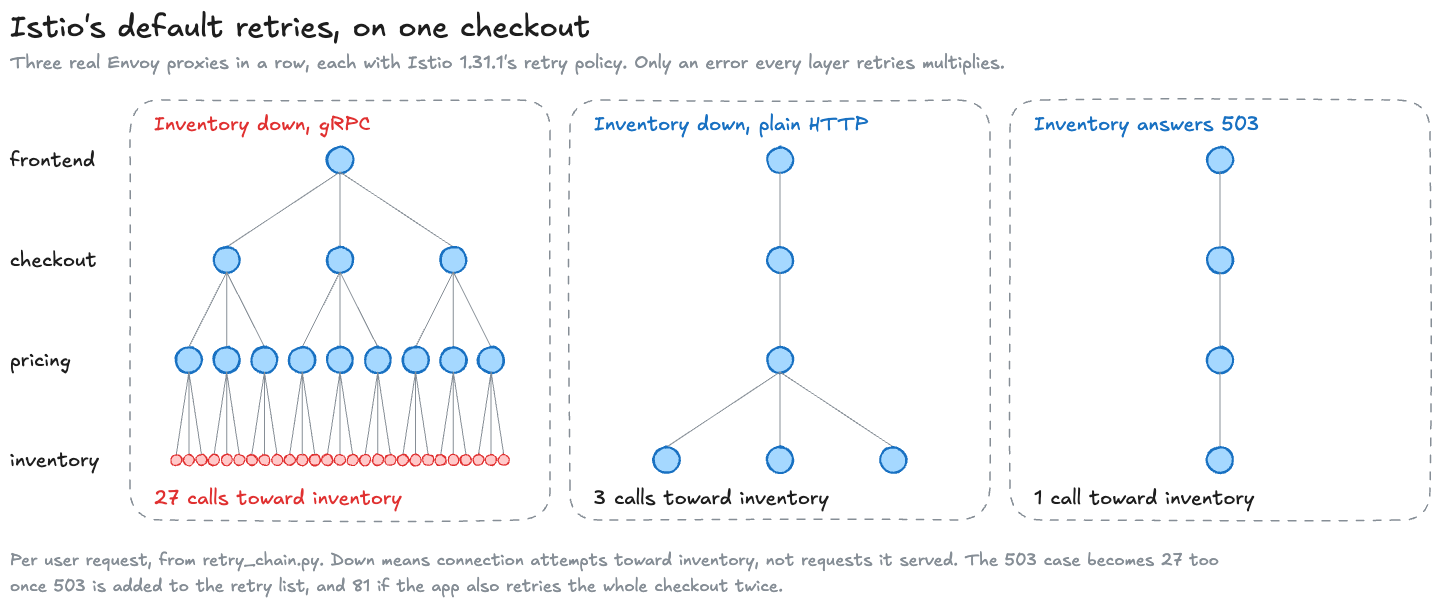
The difference between plain HTTP and gRPC is the one to understand. When pricing’s proxy can’t reach inventory, it tries 3 times and then answers its caller with an error:
- Over gRPC that error is
UNAVAILABLE, which is on Istio’s retry list, so checkout’s proxy retries it, and frontend’s proxy retries that: 27. This assumes each service in the middle passes the failure up as it got it, as a gRPC service that returns its client’s error does. In the demo there are no services between the proxies, so it always does. A service that turns the error into something else stops the multiplying. - Over plain HTTP the error is a 503. Although
retriable-status-codesis on the list, Istio’s default names no status codes, so the proxy above doesn’t retry a 503, and the multiplying stops after the first hop: 3. - If inventory itself answers 503 at once, nobody retries it, and there’s 1 attempt.
The documented default and the code's
Istio’s documentation gives the default as connect-failure,refused-stream,unavailable,cancelled, without retriable-status-codes. With no status codes listed, the two behave the same.
That’s good news for the backpressure post’s advice. A service that sheds load with a fast 503 is not retried by Istio’s defaults: one call in, one call out. The common change that undoes it is adding 5xx or 503 to the retry policy, because it makes the error rate look better. Then every fast refusal becomes 27 attempts on its way to the service that’s already turning work away.
Retries in your code multiply with the mesh’s, too, rather than adding to them. A client library that retries twice, inside a proxy that retries twice, makes attempts per call. If every call in a three-deep chain does both, and the error is one every layer retries (gRPC’s UNAVAILABLE, or a 503 once it’s on the list), that’s at the bottom. The table’s 81 is smaller because there the app retries only once, around the whole checkout.
Two well-known sources make the same point with their own numbers. The Google SRE book, with 3 retries on each of three layers: “a single user action may create 64 attempts (4^3) on the database” (Addressing Cascading Failures). And the Builders’ Library article, with “a five-deep stack of service calls” and “three retries at each layer”: “If each layer retries independently, the load on the database will increase 243x, making it unlikely to ever recover.” Its advice for that case is “for low-cost control-plane and data-plane operations, our best practice is to retry at a single point in the stack.”
To count it for your own chain, press Run on the calculator below. Its defaults are the sample Istio gRPC, bottom down. It leads with the calls at the bottom service, 27, and the arithmetic, then draws the chain with the calls each service receives, then lists what each change leaves at the bottom: about 1.7 with a 20% budget, 3 if only the top retries. Set Code retries per call to 2 to see the 729. It assumes every layer retries the error it gets, so for plain HTTP under Istio’s defaults its answer is the worst case:
The usual fix is a retry budget: retries are allowed only while they’re a small share of a proxy’s requests. Envoy has one, off by default, with a 20% share once you turn it on (circuit breakers); the SRE book’s version is 10% per client (Handling Overload). At steady load, either caps each layer at roughly 1.2 or 1.1 times its traffic, so a three-deep chain sends at most about or calls to the bottom instead of 27. Treat those as a ceiling rather than a guarantee. Envoy’s budget counts retries in flight rather than a share of requests over time, and always allows 3 at once, so at low traffic it doesn’t bind at all.
Timeouts that fit inside each other
The other half of the defaults is the missing timeout, and adding one has a trap in it: a try that times out isn’t retried by Istio’s default list. Envoy retries a timed-out try only when its retry list names gateway-error, 5xx or reset, and Istio’s names none of them.
I checked it with one Envoy proxy, a 300 ms per-try timeout, Istio’s retry list, and an inventory that accepts requests and never answers:
| Retry list | Tries reaching inventory | The caller sees |
|---|---|---|
| Istio’s default | 1 | a 504 after 0.30 s |
Istio’s default, plus gateway-error | 3 | a 504 after 0.93 to 0.96 s |
From retry_chain.py, 5 requests each.
A team that sets a 300 ms per-try timeout and 2 retries usually expects the second row, three tries, and gets the first. You can’t tell which you’ll get from the timeout and the retry count; you have to read the retry list.
Be careful with that fix. Envoy’s gateway-error covers a 502, 503 or 504 as well as no response at all, so adding it also makes a fast 503 retriable, and brings back the 27 for a service that sheds load. reset retries a try that got no response without touching status codes.
Once every layer does retry its timeouts, by adding one of those or with retries in the code, the timeouts have to fit inside each other. Here’s your chain with 2 retries everywhere, no timeout at the top, and timeouts set by hand in checkout and pricing, when inventory hangs:
call per try tries worst case callee's tries that fit in one of its triesfrontend -> checkout none 3 9.20 s 3 of 3checkout -> pricing 1.00 s 3 3.05 s 1 of 3pricing -> inventory 500 ms 3 1.55 sthe top call can take 9.20 s when the bottom hangs; the user's app waits 2.00 s, so it does not fitthe app gives frontend 2.00 s in all, but frontend's 3 tries need 9.20 s: none can finish, so all 3 are work nobody waits forcheckout gives pricing 1.00 s per try, but pricing's 3 tries need 1.55 s: only 1 can finish, and the other 2 are work nobody waits for...From timeout_budget.py, with 25 ms between tries, Istio’s base backoff. It goes on to flag the missing timeout at the top.
Read it from the bottom. Pricing’s three tries at inventory need 1.55 s, two 25 ms waits included, but checkout gives pricing only 1 s per try, so only one of pricing’s tries can finish. Checkout’s three tries at pricing need 3.05 s, and frontend has no timeout, so it can repeat all of that three times: 9.2 seconds for a request your app gives up on after 2. Most of those tries are made for nobody. These are budget calculations, not a measurement: whether the work below actually stops when the caller gives up depends on deadlines being passed down and calls being cancelled.
The rule that fixes it is the SRE book’s advice on deadlines turned into arithmetic: each layer’s tries, with their backoff, have to fit inside one try of the layer above, so timeouts shrink going down the chain. For example, 1.8 s at the top with no retry, 800 ms with one retry in the middle, and 225 ms with two at the bottom. Its worst case is 1.48 s, inside the app’s 2.
Leave room for the real backoff, too. Envoy’s documentation says “the first retry will be delayed randomly by 0-24ms, the 2nd by 0-74ms” (router filter). So pricing’s three 225 ms tries take at most ms of checkout’s 800. That fits, with 27 ms to spare for everything else at that boundary. I wouldn’t run with a margin that thin: a slow lookup or a garbage-collection pause would use it up, so I’d shrink the bottom timeout until the margin covers them.
Envoy's code waits less than its documentation says
In Envoy 1.39.3 the jittered backoff draws each wait as a random number modulo the current interval, which starts at the 25 ms base and doubles after each retry (backoff_strategy.cc). That gives 0 to 24 ms before the first retry and 0 to 49 ms before the second, not the documentation’s 0 to 74 ms. I’ve used the documented figure above, because it’s the larger and the one Envoy promises. I read this in the source and didn’t measure it.
To check your own chain, type it into the checker below, one call per line, top first, and press Run. Its defaults are the chain above. It leads with “Can take 9.20 s; the caller gives up after 2.00 s”, then lists the calls whose tries can’t finish in their caller’s time, with the per-try timeout that would fit: 650 ms or less for frontend’s call, 316 ms or less for pricing’s. Its “Fit” column counts each call’s tries against its caller, where the script’s last column counts the callee’s. Try the sample Shrinking timeouts for the fixed version:
Count before you choose
So, does your shop need a mesh? I’d decide by counting, not by feature list:
| Count | Points towards |
|---|---|
| How many languages your services are written in | One: a library may be enough. Three or more: a mesh starts to pay for itself |
| How many services need to prove who they are to each other | A handful: certificates by hand or in a library. Dozens: a mesh, or at least its identity system |
| How deep your important call chains go | Deep chains pay the per-hop cost several times, and can multiply retries several times |
| Where the checks are required | If the review only asks about the front door, an ingress proxy is enough. Calls between services need checks inside the system |
| Who will own the proxies | A mesh is a platform. Someone has to own its upgrades, its certificates and its defaults |
For your shop, three languages and a review that’s explicitly about calls between services put it on the mesh side. But I’d write the configuration before switching it on, because a mesh applies its defaults from the first request: a timeout on every route that fits inside its caller’s, retries only on calls that are safe to retry and on failures worth retrying, a budget on all of them, and limits on waiting requests that mean something at each service’s real throughput.
The history, briefly
Before sidecars, this lived in libraries: Finagle and Hystrix put retries, timeouts and circuit breakers into every service, on the JVM. Proxies, first Linkerd and then Envoy under Istio, moved that work out of the code so it worked for any language. Kubernetes added first-class support for sidecars, “Stable since Kubernetes v1.33” (sidecar containers). And Istio’s ambient mode, which reached general availability in Istio 1.24 on 7 November 2024 (announcement), moves the proxy from every pod to every machine. That’s why its per-node ztunnel costs a fraction of a sidecar in Istio’s own figures, though a ztunnel and a sidecar don’t do the same work, so compare whole paths rather than one proxy with another.
The demo
The scripts are in service-mesh/ in mainlog-code. The two that run proxies need envoy on the path; the other two need nothing beyond Python:
cd mainlog-code/service-meshbrew install envoy # or the envoyproxy/envoy image on Linuxpython3 bench_hops.py # latency and CPU per hop, about 20 minutespython3 retry_chain.py # the retry table and the timeout trap, about a minutepython3 retry_fanout.py # the fan-out arithmetic, no proxiespython3 timeout_budget.py # the timeout table, no proxiesThe recorded runs behind every number in this post are in its results/ folder, with the Envoy version and the machine. Its CI is written to run the two arithmetic scripts and the retry chain against a pinned Envoy and check the lines this post quotes. The laptop’s latency numbers are there to inspect and reproduce, not to use as thresholds.
So your shop pays about a fifth of a millisecond per hop, about 0.7 ms along the checkout, and a tenth of a core per proxy for every thousand requests a second, to meet the security review in every language without touching the code. That looks like a fair price for work shared across four teams. The bill that matters more is the one nobody reads: a queue with no limit, a timeout that isn’t retried, and a retry policy one edit away from turning a failing service into 27 calls. Each is a few lines of configuration, and each is worth deciding on purpose, before the next sale.
Related posts

Backpressure and load shedding
A shop's checkout service can answer 100 requests a second, and for one minute 150 arrive. Left at the usual default, it answers 8% of those people in time; refusing the overflow at once answers two thirds. Capacity decides how many can be served. The policy decides whether they are, and only the question of who is a product decision.
Down to the wiredistributed-systemsreliabilityperformance
Observability-driven development
A deploy makes checkout slow for 0.9% of requests, and the dashboard's median doesn't move. Writing down the question you'd ask if it broke, and making a test prove the telemetry can answer it, is what finds them. Plus what that telemetry costs, in series and in microseconds.
Down to the wireobservabilitydistributed-systemstesting
More samples, same sound
Converting audio to a higher sample rate makes it fit the next program; it cannot bring back sound an earlier step removed. Three test tones show why.
Down to the wireaudioperformance
 Systems
Backpressure and load shedding
A shop's checkout service can answer 100 requests a second, and for one minute 150 arrive. Left at the usual default, it answers 8% of those people in time; refusing the overflow at once answers two thirds. Capacity decides how many can be served. The policy decides whether they are, and only the question of who is a product decision.
distributed-systemsreliabilitySep 2026 Systems
Observability-driven development
A deploy makes checkout slow for 0.9% of requests, and the dashboard's median doesn't move. Writing down the question you'd ask if it broke, and making a test prove the telemetry can answer it, is what finds them. Plus what that telemetry costs, in series and in microseconds.
observabilitydistributed-systemsSep 2026 Networking & media
More samples, same sound
Converting audio to a higher sample rate makes it fit the next program; it cannot bring back sound an earlier step removed. Three test tones show why.
audioperformanceSep 2026
Comments