Introducing toolbench: a tiny framework for interactive web tools
Write the function that computes the answer, and toolbench builds the tool around it.
On this page · 9 sections
- A function and a manifest
- The choices, and what each costs
- What the website writes once
- How the pieces fit
- A form from ten input types
- A result is data, not markup
- Graphs, drawn the same in every browser
- Nothing runs until the reader presses Run
- Code arrives when it is about to be used
- The page decides how a tool looks
- Trying it
The interactive tools on mainLog are small: a decoder for STUN messages, a queueing calculator, a state machine analyzer. Each one is a computation with a form in front of it and an answer to draw, and the computation is what makes each one worth having. Everything around it, the form, the error and loading states, the drawing and the tests that keep last year’s answers right, is the same kind of work every time, and most of what differs can be described as data.
Toolbench is a small framework for tools like these. A tool is a pure function that computes an answer, plus a JSON manifest that describes its inputs and the kinds of result it can return. The runtime builds the form from the manifest, runs the function, and draws whatever it returns. I built it so that each new tool on mainLog would cost a function rather than another front end. This post is the introduction, and the second part goes inside.
Toolbench is two npm packages, @toolbench/sdk and @toolbench/runtime, with documentation and a gallery and the source on GitHub.
The short version
- A tool returns data, and the runtime owns everything the reader touches. The form, the Run button, the loading state, the errors and the drawing all come from the manifest and the return value.
- The website writes its side once. After that, another tool needs no site code.
- By default nothing runs until the reader presses Run, and a tool’s code is downloaded only when the tool is about to be used.
- The page decides how a tool looks, through custom properties and a stylesheet of its own, so a tool needs no CSS.
A function and a manifest
The smallest tool takes a name and says hello. This is the whole function:
import type { Output, Tool } from "@toolbench/sdk";
type Input = { name: string };
export default { run({ name }): Output { const who = name.trim(); if (who === "") return { kind: "error", message: "Type a name.", input: "name" }; return { kind: "text", text: `Hello, ${who}.` }; },} satisfies Tool<Input>;run receives plain values and returns a result tagged with its kind: a line of text, or an error that names the input at fault. The import is types only, so the tool has no runtime dependency on toolbench, and nothing in it knows about the DOM.
This is its manifest:
{ "sdk": 1, "id": "hello", "name": "Hello", "blurb": "Says hello to a name.", "version": "1.0.0", "capabilities": ["pure"], "runtime": { "entry": "index.ts" }, "kinds": ["text", "error"], "inputs": [{ "id": "name", "type": "text", "label": "Name", "default": "Ahmed" }], "help": "README.md"}inputs describes the form, and kinds lists the result kinds the function may return. sdk: 1 is the version of the contract the tool is written against. pure says the answer depends on the declared inputs and nothing else: no clock, no unseeded randomness, no network and no files. The validator insists on error in kinds, because every tool can be given bad input, which is why even this one has an empty-name check.
For those two files the runtime draws a labelled field, a Run button that also answers to Enter, and the result. When the function returns an error naming name, the runtime marks that field invalid and ties the message to it with aria-describedby, the attribute a screen reader uses to read a description with its field.
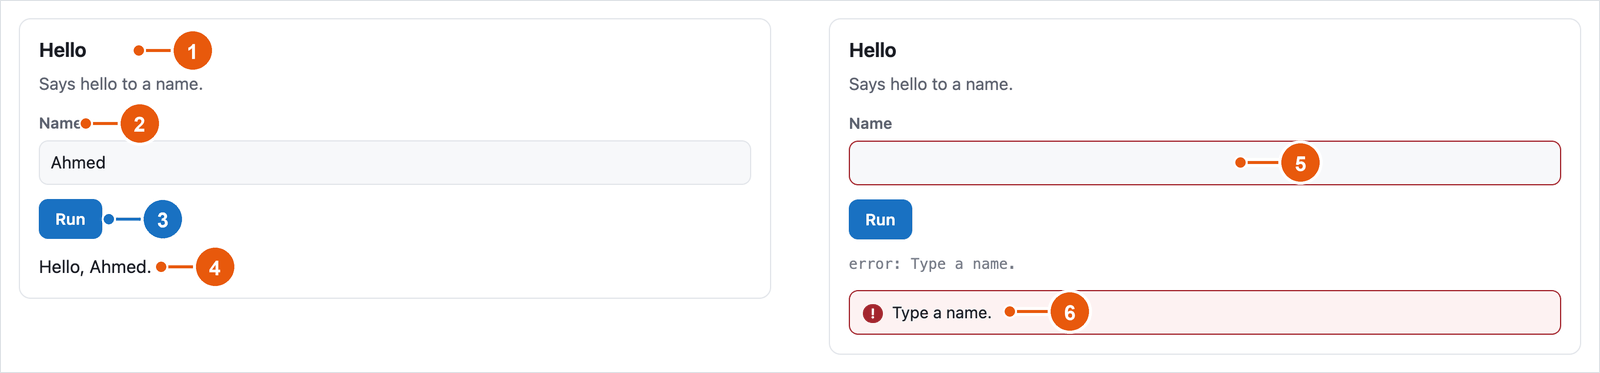
A third file, cases.json, holds the tool’s known answers: inputs paired with the exact results they must produce, here for the default name, a name with spaces around it, and an empty one. The example is in mainlog-code, runnable, with its test and the page in the screenshot.
The choices, and what each costs
My first plan for mainLog was a Svelte island per tool, an island being an interactive component the page hydrates on its own. It is the quickest way to ship one tool, and it makes every later tool a small front-end project of its own.
The serious alternative was the middle ground: shared form and result components, with each tool’s computation pulled out into a plain function. That is close to where toolbench ended up, and a good shared wrapper would centralise much of the glue. The difference is a deliberate restriction. In toolbench a tool author can only describe inputs and return data, so no tool can grow a UI of its own, nothing in a tool imports a component, and one harness can check every tool the same way. For small tools whose value is the computation, I think that restriction is worth more than the freedom it takes away. The price is a vocabulary the framework has to define and keep, a handful of input types and a closed list of result kinds, where a component could draw anything.
An iframe per tool keeps tools apart in a different way. Each one is a second document with its own styles, so following the page’s theme needs a bridge between the two documents, and sizing it to its content needs another. Both could be shared code, but I didn’t want every tool in a post to be a page inside a page.
I also chose a published package over a shared folder inside the blog. A folder is cheaper on day one, but nothing stops code in it from importing the blog’s own modules. Toolbench lives in its own repository and depends on nothing, so reaching for the blog’s code isn’t an option, and an assumption about the site has to be made explicit in the contract or not made at all. The blog pins a version, so when something breaks there is a version to point at. The cost is the work of releasing it, a version for every change and notes a reader can follow. An upgrade can also change how every tool looks at once, because the contract covers what a result means, not its pixels.
For the form, a JSON Schema form generator such as react-jsonschema-form or JSON Forms is the obvious starting point. They solve the input half and stop there: no runner, no result rendering, no known answers, and each brings a UI framework with it. Toolbench’s contract covers inputs, running and results together, and its validator holds tools to rules a general schema leaves optional. A number input must declare min and max, because a tool’s running time often grows with a number, and a declared range means the author has decided the largest input the tool must handle. A JSON Schema can say the same, but nothing requires it to. Likewise a select needs at least two options with its default among them. I wrote that validator by hand, because its messages are the first thing a new tool author meets. This is what it says about a timeout on a tool that runs on the main thread:
is only meaningful with runtime.thread = "worker". On the main thread there is nothing to terminate, so a timeout here would be a field that lies. Either move the tool to a worker or bound its input.The last choice was the shape of the runtime: a component for one framework, or a custom element, an HTML tag whose behaviour the page registers itself, with a shadow root, a DOM subtree whose styles are isolated from the page in both directions. I chose the custom element because a page needs no framework to use one. The toolbench test bench is a plain Vite page for that reason, and the hello world runs in plain HTML. Keeping the runtime free of dependencies also means it builds its DOM by hand, with createElement and three small helpers, and a page can style a tool only through the hooks it is given.
What the website writes once
The host is the website that embeds toolbench. Its part is small, and it exists because only the site’s own bundler can find the site’s tool files.
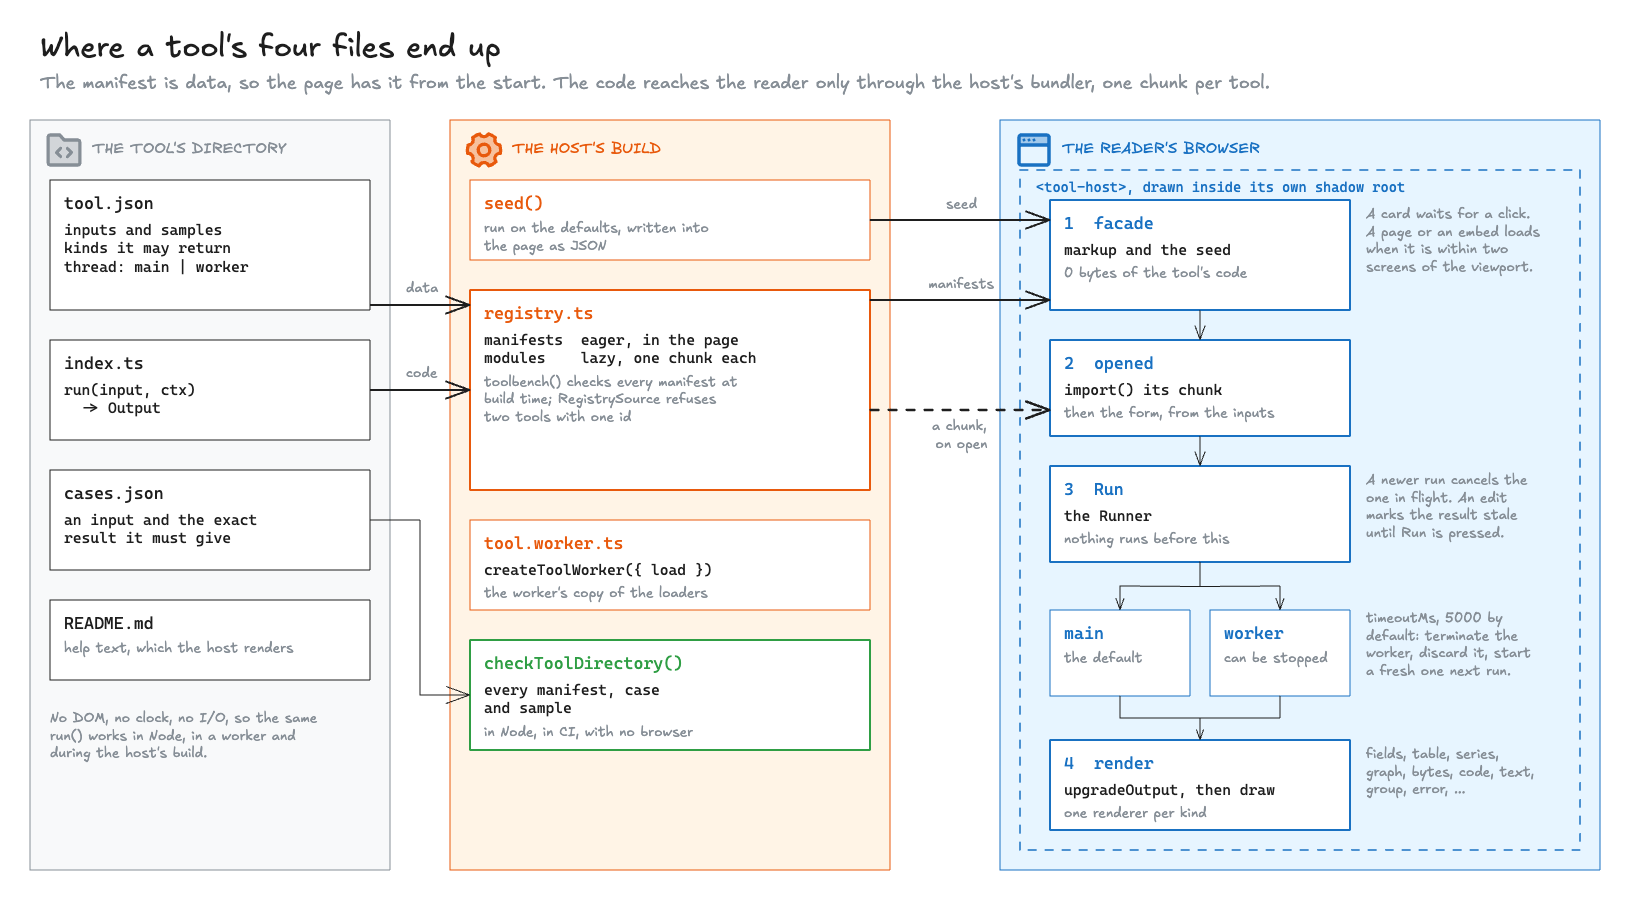
The two packages split along the same line. @toolbench/sdk is what a tool author and a site’s build import: the types, manifest validation, version migration, seed computation and the fixture harness. It never touches the DOM, so all of it runs in Node. @toolbench/runtime is what the page imports: the <tool-host> element, the runner that calls the function, and one renderer per kind of result.
The one file every host writes is a registry, and its heart is two file patterns:
const manifests = import.meta.glob<Manifest>("../tools/*/tool.json", { eager: true, import: "default" });const modules = import.meta.glob<ToolModule>("../tools/*/index.ts");import.meta.glob is how Vite, the bundler here, finds files by pattern at build time. The registry includes every manifest, so it can show a tool’s name and inputs before loading its code. The modules are lazy, so the bundler turns each tool into its own chunk, a separate JavaScript file the browser fetches only when asked. Both patterns have to be literal strings, because the bundler resolves them when the site is built.
The whole registry, for the curious
import { RegistrySource } from "@toolbench/runtime";import type { Manifest, ToolModule } from "@toolbench/sdk";
const manifests = import.meta.glob<Manifest>("../tools/*/tool.json", { eager: true, import: "default" });const modules = import.meta.glob<ToolModule>("../tools/*/index.ts");
const idOf = (key: string) => key.split("/")[2]!;
export const loaders = Object.fromEntries(Object.entries(modules).map(([key, load]) => [idOf(key), load]));
export const source = new RegistrySource( Object.fromEntries( Object.entries(manifests).map(([key, manifest]) => [idOf(key), { manifest, load: loaders[idOf(key)]! }]), ),);RegistrySource pairs each manifest with its loader and refuses two tools with the same id. The manifests are checked before any page sees them: a Vite host adds toolbench() from @toolbench/runtime/vite to its config, which validates and upgrades each tool.json during the build and fails the build on a bad one, so the checker never reaches a reader. Without that step the registry checks them in the browser instead, and each page pays for it before its first tool paints. loaders is exported for a worker entry, which needs the modules and not the manifests.
The hello world page registers the element with one call:
import { defineToolHost } from "@toolbench/runtime";import { source } from "./registry.ts";
// The whole of a host's setup for a tool that runs on the main thread: where the tools are.defineToolHost({ source });That defines the <tool-host> custom element. The page itself contains one <tool-host tool="hello" mode="page"> and no other toolbench markup.
A site with tools that run in a worker also writes a six-line worker entry, for the same reason: the worker has to import tool modules, and only the host’s bundler can see them. The rest of what a host can pass, page URLs, a stylesheet and a code highlighter, is in the host reference.
How the pieces fit
Code and data live in three places: the site’s build, the host’s code written once, and the reader’s browser. One boundary runs through all three. The manifest is data and can be read at any time, while the tool’s code has to be present when the site is built.
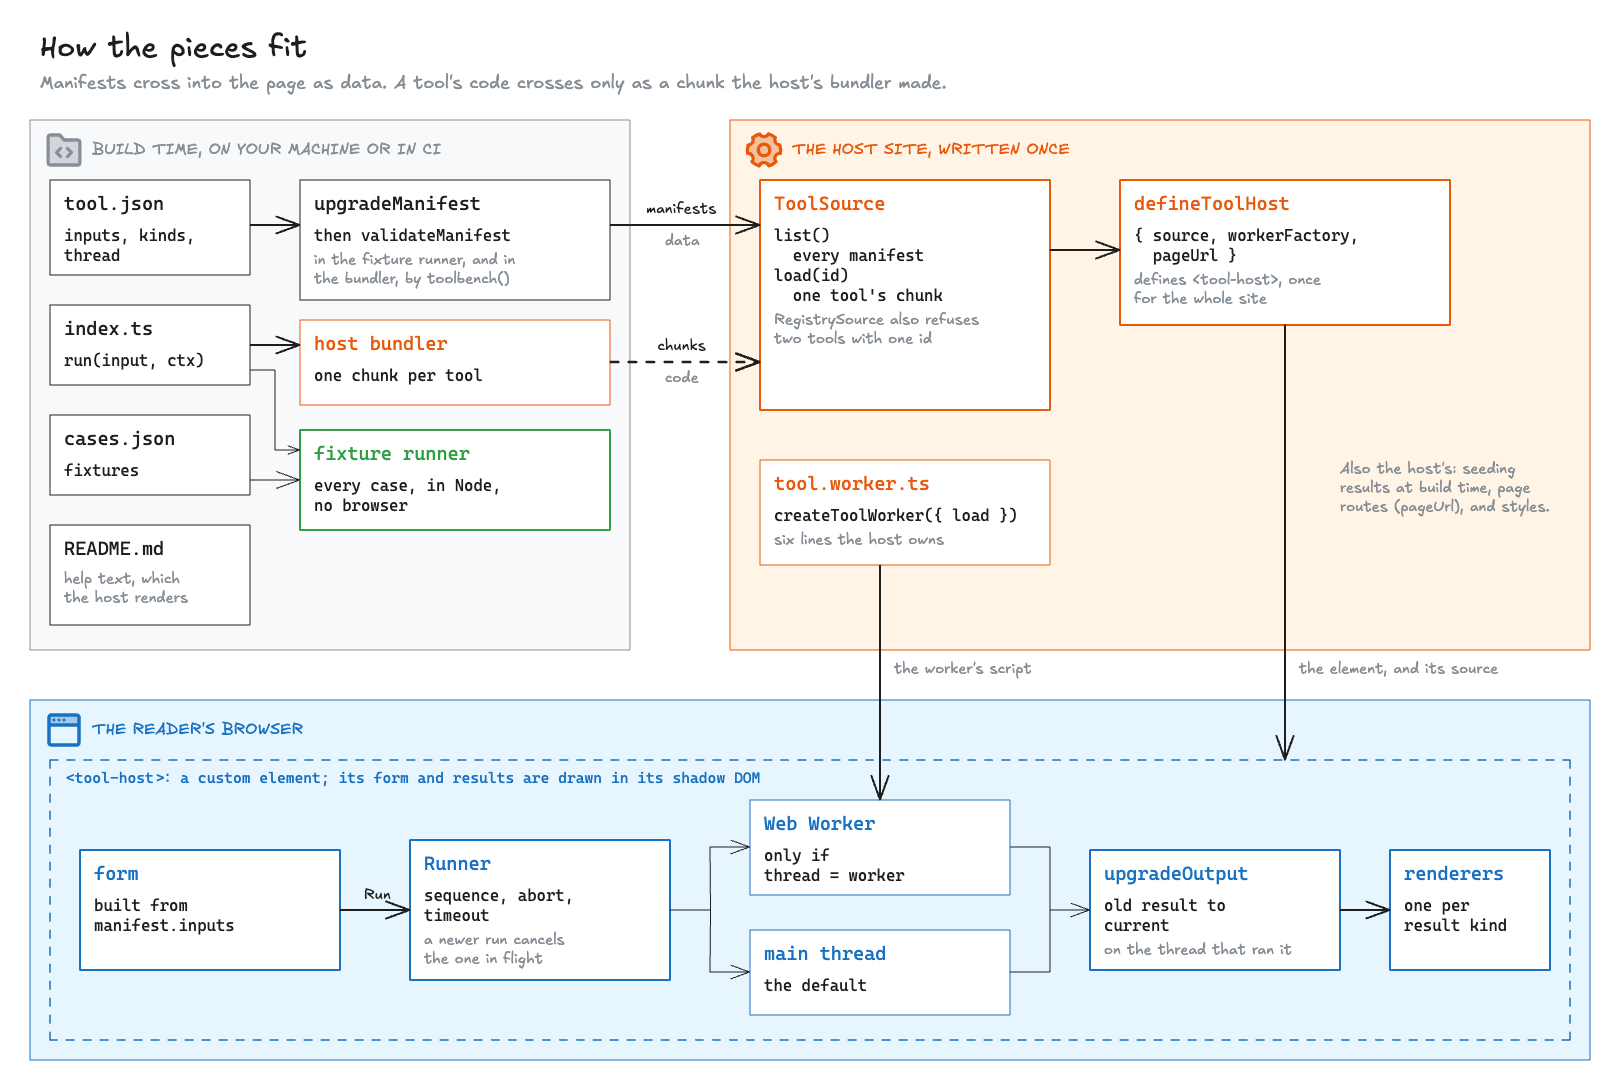
Four things in that picture carry the design:
- A manifest is upgraded and validated before anything else sees it, so every part downstream deals only with current, well-formed data.
- A tool’s code reaches the browser only through the host’s bundler. The browser fetches chunks the build made, and never code from anywhere the build didn’t see, which keeps bundling, tree shaking and a strict Content-Security-Policy working.
- The worker is optional and per tool. The runner’s interface is the same either way, so once a host has its worker entry, a tool moves to a worker by changing one line of its manifest.
- Results are upgraded on the way out, so a tool written against an older contract is drawn by today’s renderers without knowing it.
Inside the browser, <tool-host> is the hub. It asks the registry for manifests and code, asks the runner for results, and asks the renderers for markup, and it reaches a worker only through the runner. The architecture docs follow each of those paths in detail.
A form from ten input types
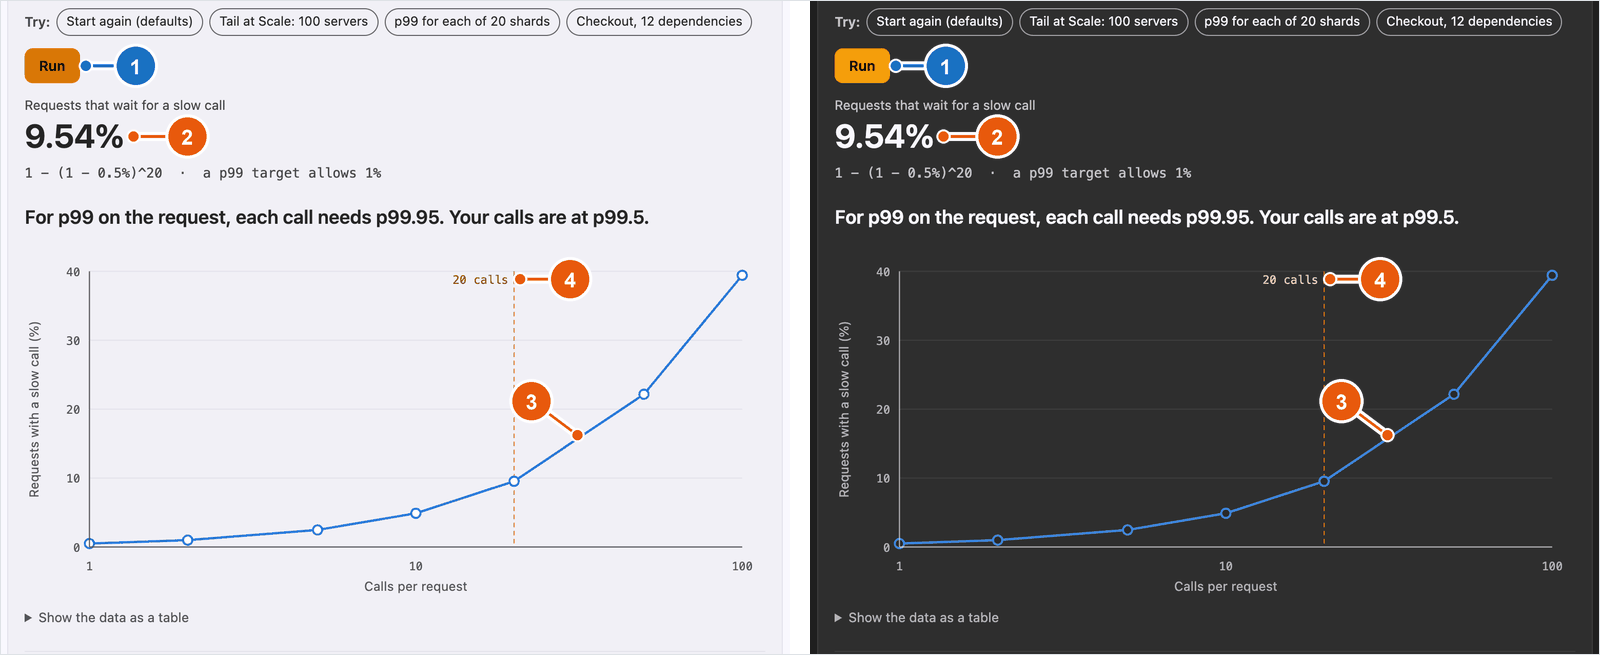
There are ten input types. Five were there from the start: text, textarea, number, select and toggle. A number must declare its range and can show a slider, and a select’s options can fill in other inputs, so one choice such as an SDK’s name can set its timeout and retry defaults. The other five came in 0.15.0: date, color, secret for a password that stays out of links, multiselect, and rows, a list the reader adds to and reorders. A select with a few short options can also be drawn as a row of segments. The Fan-out tail latency calculator on mainLog is a form built from them, three short inputs and a textarea, each with its description under it and a row of samples below. It works out how often a page that waits for many backend calls is held up by one slow call:
Press a sample, then Run. The answer is a headline number, a formula, a sentence and a chart, and the tool’s code drew none of it: the labels, the descriptions, the sample buttons, Run and the Reset beside it, and the chart’s axes and hover readout all come from the runtime.
So does the link icon at the end of the Run row. It copies this page’s address with the tool’s inputs in it, each named after the tool, as in fan-out-tail.calls=50, so the three tools in this post never read each other’s, and the link opens the tool with those inputs. An input the manifest marks "share": false, such as a pasted packet or a password, stays out of every link.
An input’s description is drawn under the field, not as a placeholder, because placeholder text disappears the moment someone starts typing, which is when they need it. It can hold a short list, code and bold, and a long one can keep the one line that matters there and the rest in details, behind a “More” that stays closed until the reader opens it.
Samples are example inputs in the manifest, drawn as a row of buttons under the form. They belong to the tool rather than to the page, because the tool is what knows which inputs are interesting. They came into the contract when I wanted example packets beside a decoder, and the most useful one turned out to be a malformed sample, because it shows a reader how the tool reports a mistake before they make one.
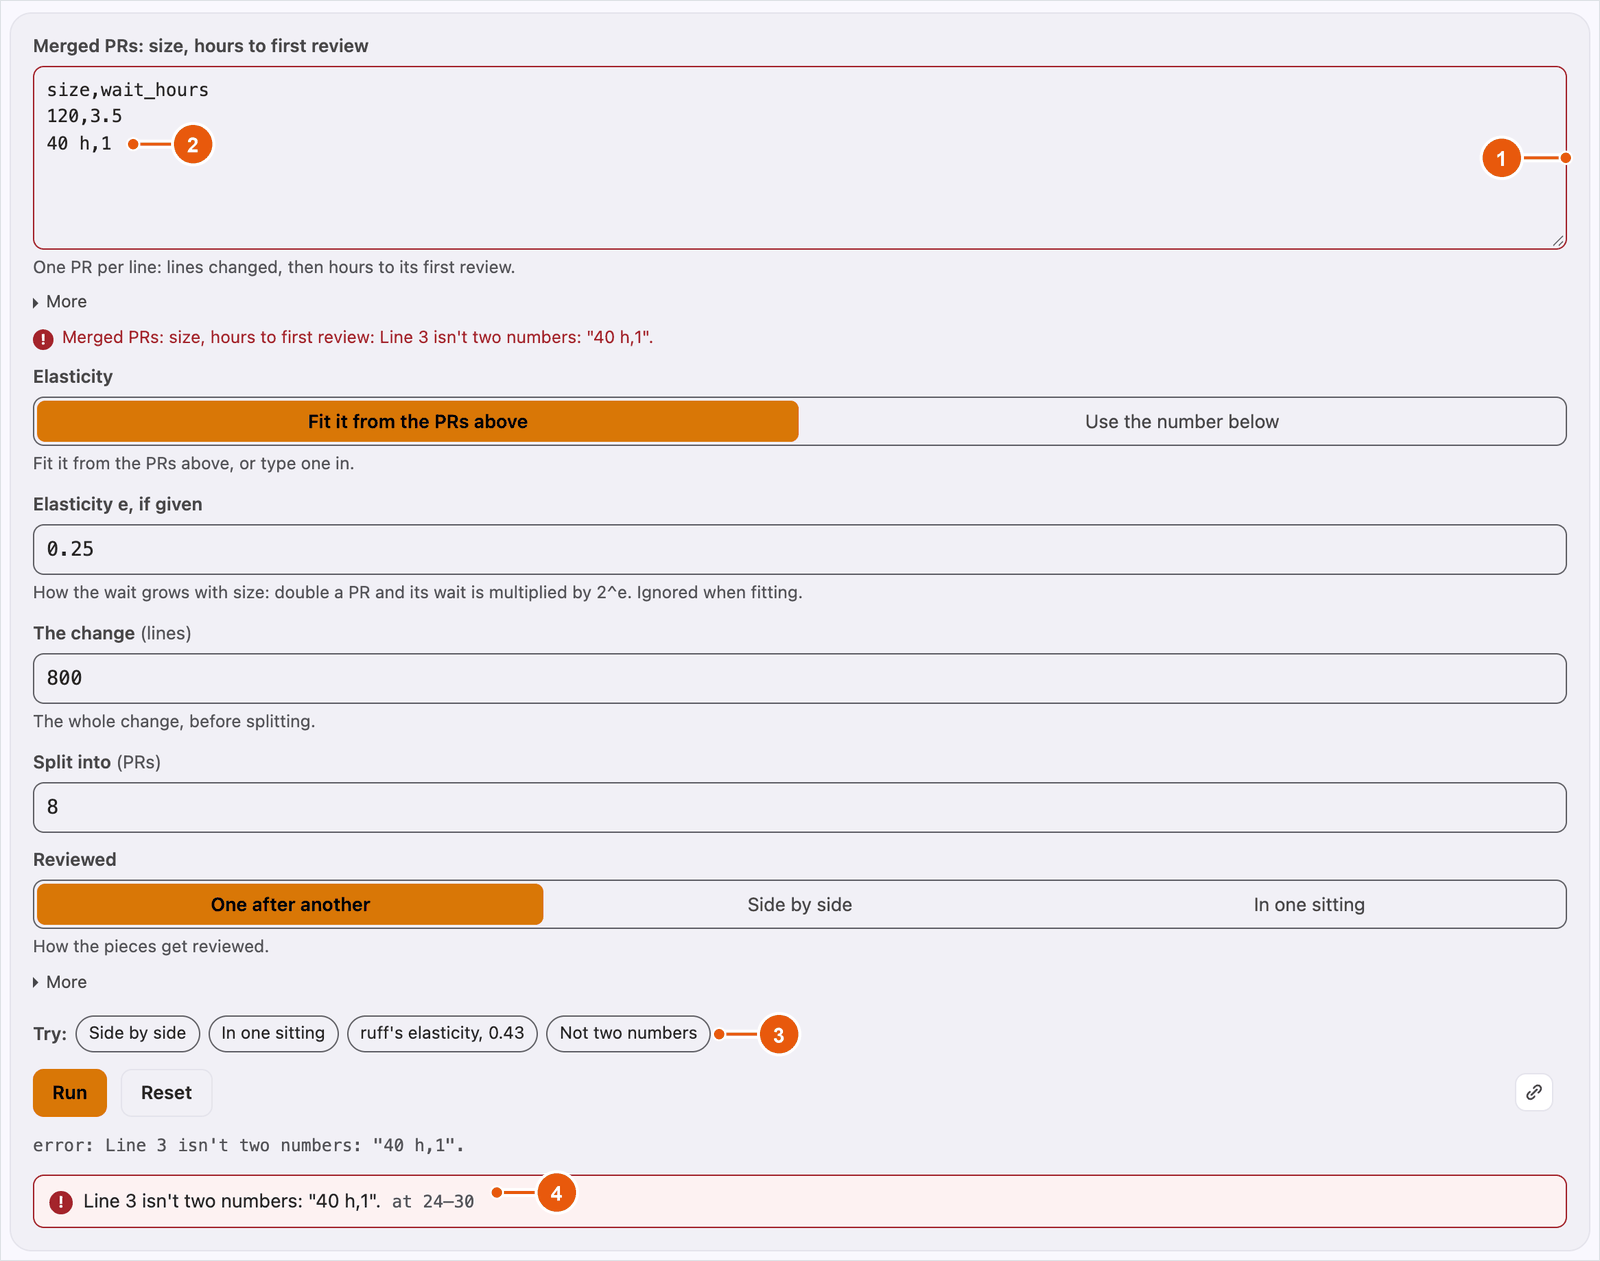
40 h,1 (2), and the message carries the characters it means, 24 to 30 (4).The error in that screenshot is an ordinary return value, { kind: "error", message, input, at, len }. input names the control at fault, and at and len say which characters, so the runtime can mark the field aria-invalid and point at the problem.
Bad input and a bug are different failuresA returned
errormeans the input was wrong and the tool worked, and the reader sees the tool’s own message on the field. A thrown exception means the tool has a bug, and the reader sees “This tool hit a bug and stopped” while the stack goes to the console.
A result is data, not markup
A tool never draws its answer. It returns a value whose kind says what it is, and the runtime has one renderer for each kind. The list is closed on purpose, so a tool can’t invent a shape that nobody can draw. The results reference has every field of every kind.
| Kind | What the runtime draws |
|---|---|
text, code | Prose or preformatted source |
fields | Labelled values, optionally grouped |
table | Rows and columns with alignment and cell tones, and a layout of its own on a phone |
bytes | Offsets, hexadecimal bytes and named ranges |
series | Lines, bars, areas or points, with a data table |
heatmap, pie, radar, treemap, venn | The corresponding chart, each loaded separately |
graph | Nodes and edges positioned by the runtime |
group | Several result parts in one answer |
error | An explanation of rejected input |
The STUN message decoder on mainLog shows what a group is for. STUN is the small protocol WebRTC uses to find out which public address a computer is seen at. For one message the decoder returns a group: the answer as labelled fields, a table of the decoded attributes, and the raw bytes with each attribute’s range marked. Abridged, the value it returns for its default message is this:
{ kind: "group", parts: [ { kind: "fields", role: "answer", fields: [ { label: "Message", value: "Binding success response", note: "0x0101" }, { label: "Mapped address", value: "192.0.2.10:54321", note: "Where the server saw the sender." }, // ... ] }, { kind: "table", role: "decoded", columns: [/* Offset, Attribute, Value, ... */], rows: [/* one per attribute */] }, { kind: "bytes", bytes: [1, 1, 0, 12, 33, 18, 164, 66, /* ... */], highlight: [ { at: 0, len: 4, label: "Type and length" }, { at: 20, len: 12, label: "XOR-MAPPED-ADDRESS" }, // ... ] }, // ... ],}Nothing in it says how anything looks. This is the decoder itself, running in the post:
Press Run on the default message. It decodes to a Binding success response from a server that saw the sender at 192.0.2.10:54321, and the table and the byte view show where in the message each of those facts came from. The samples under the form are other real messages, one of them copied out of Wireshark.
Because the decoder only returns data, the same function runs in Node for its known answers, in a worker, or during a site’s build. The contract asks that run never touch the DOM, and none of those places has one, so a tool that reached for it on a path its known answers exercise would fail before it reached a page.
The closed list is enforced at both ends. The renderer’s switch over the kinds ends in a TypeScript exhaustiveness check, const _exhaustive: never = output;, so a kind added to the SDK without a renderer doesn’t compile. The fallback after it covers what a compiler can’t see, an older runtime cached in someone’s browser meeting a newer tool, and draws a message asking for a newer runtime rather than an empty box.
Graphs, drawn the same in every browser
A table of edges is a poor way to see that one state of a machine can’t be reached. The State machine analyzer on mainLog checks a machine written as states and events, and I wanted that machine drawn, which is where the graph kind came from. This is the analyzer itself, and the graph is the third part of its answer:
Press Run to draw the machine in the form, then scroll past the table to the third part of the answer. A wide graph is scaled to fit its column, and the button at its corner shows it at full size, which on a phone is the way to read it. The picture is one tab stop, and the arrow keys follow its edges. Every edge is also listed in a table under it, for a reader who can’t use the picture.
The first design for graphs put a fixed cap on the number of nodes, past which the runtime would draw a message instead of a picture. I didn’t want a cap in the framework. How big a graph is worth drawing depends on the tool, so a tool sets its own limits, and past them the runtime lists the graph instead of drawing it. What I did want from the runtime was harder. Edges should be orthogonal, made only of horizontal and vertical runs, and leave a node from the middle of a side rather than wherever they happen to land, with as few crossings as possible. The picture should be the same in every browser, so a screenshot in a post or a bug report shows what every reader sees. And a page should download only the drawing code its graph needs.
How the layout and the routing actually work, the algorithm, the port rules and the arithmetic that keeps the layout identical in every browser, is in the second part.
Nothing runs until the reader presses Run
By default, opening a tool paints the form and stops. The function runs when the reader presses Run, or presses Enter in a one-line input, or Cmd or Ctrl with Enter in a textarea.
I made that the default because most of these tools take several inputs that only make sense together: a packet and the view to decode it in, an arrival rate and a service time and a target. Running on open and again on every keystroke would compute answers for half-typed inputs, and it makes the Run button meaningless, because the answer is already there by the time anyone looks at it.
When an input changes after a run, the last answer stays on screen, dimmed, and the status line says so. I keep it because it is still the true answer to the previous inputs, and having it there is what lets a reader compare before and after.
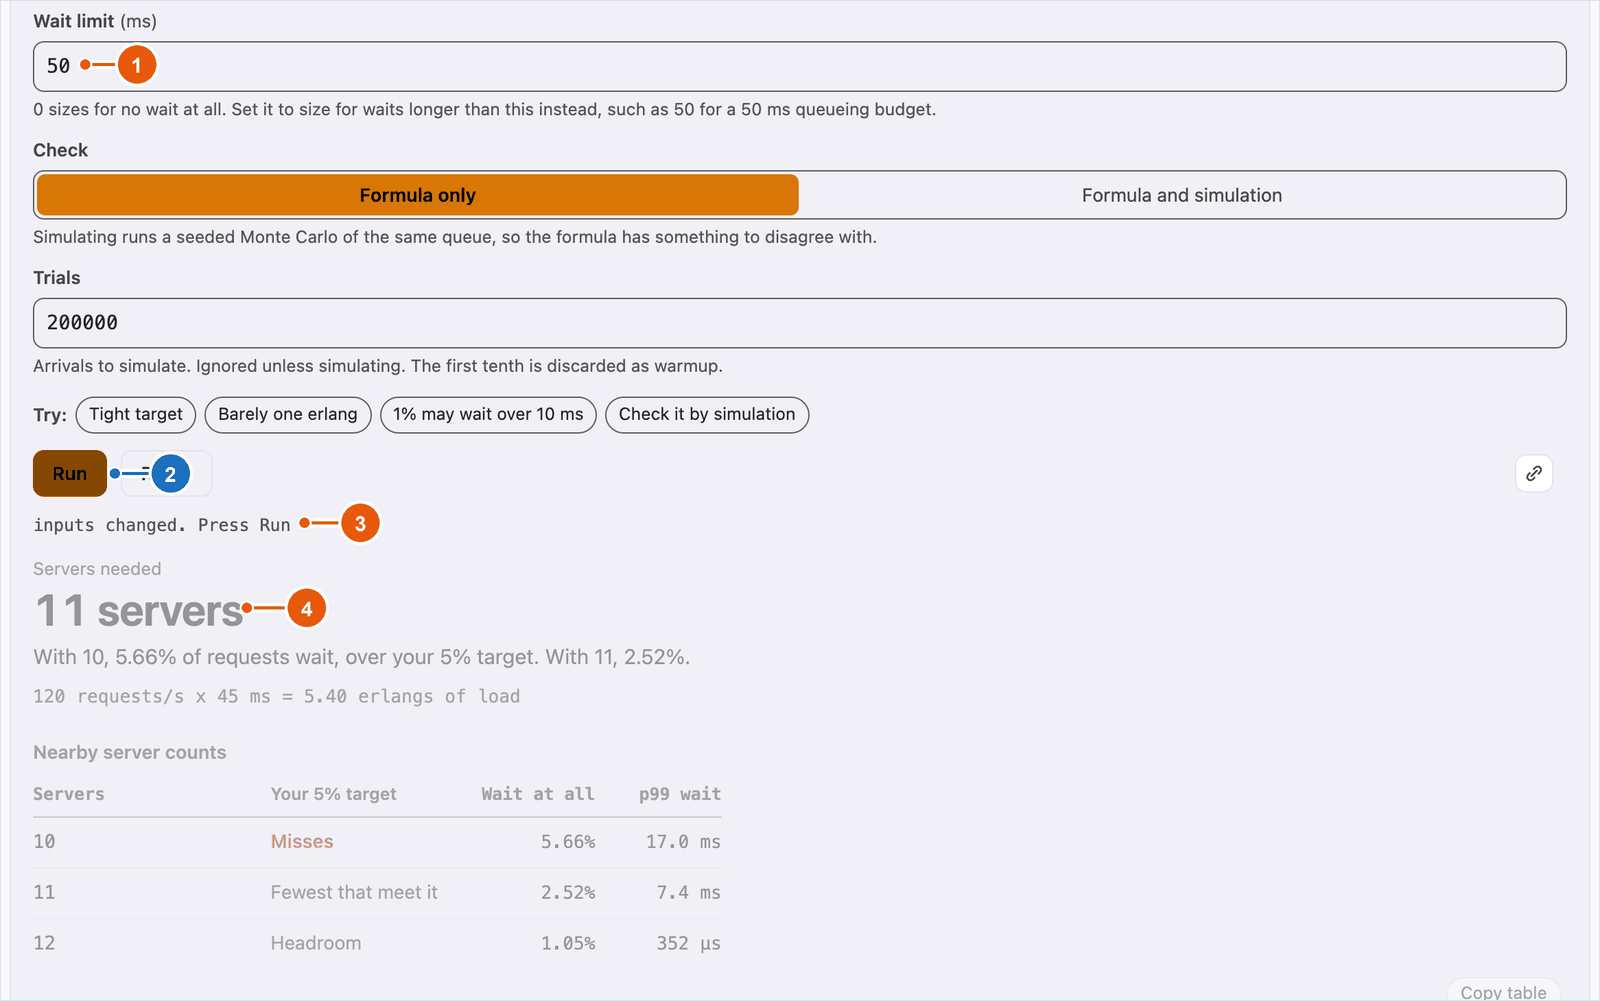
The progress bar follows the same idea. It appears only if a run is still going after 400 ms, because a bar that flashes for twenty milliseconds on every fast run tells the reader nothing.
A tool that is genuinely instant can opt back into running as the reader types, with "autoRun": true. The validator refuses it on a worker tool. Worker tools are the ones that can be slow, and I don’t want the slowest tools launched on every keystroke.
Code arrives when it is about to be used
A tool can sit on a page in three modes. A card is the compact form, with the name, a short description, the main inputs and the first part of the answer, and it fetches the tool’s code only when the reader opens it. page shows everything, and embed is the same without the title, for the middle of an article. Those two fetch the code when they come within two screens of the viewport, except that a tool running in a worker leaves its code to the worker, at the first Run. Until then a tool is a facade, a term from web performance work for a cheap stand-in that the real thing replaces when the reader asks for it; Lighthouse recommends the pattern for heavy embeds such as video players.
A closed card doesn’t have to be empty. A seed is the tool’s answer for its default inputs, computed during the site’s build by the SDK’s seed() and written into the page as data, so a card can show a real answer before any of the tool’s own code has loaded. seed() throws if a tool crashes on its own defaults or rejects them, so a broken tool fails the site’s build instead of shipping a card with an error baked into it. Because the seed is computed by the same function on every build, it can’t drift from what the tool answers, which a hand-written one can.
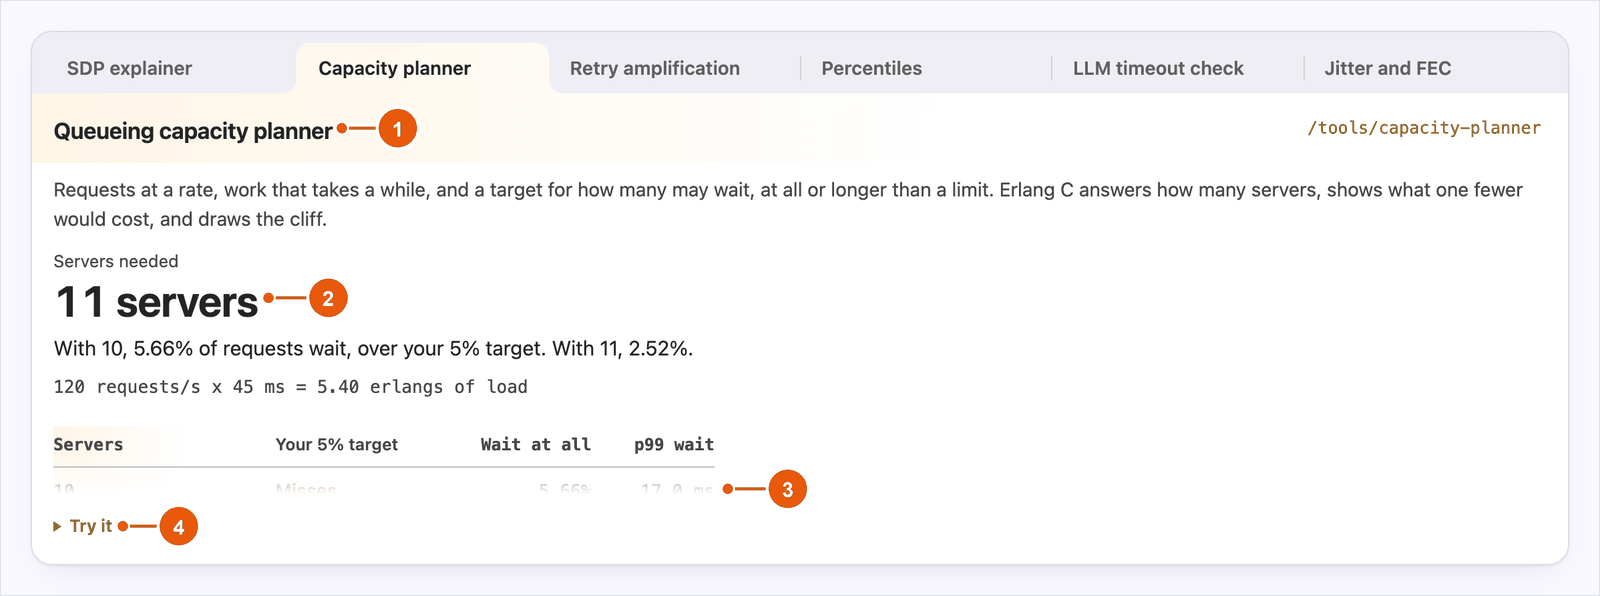
The tools in this post open as forms, without a seed.
On mainLog, a page with no tool downloads none of toolbench, and a tool’s own code is a few kilobytes that arrive only on demand. The second part has the measured numbers, including the part that costs more than it should.
The page decides how a tool looks
Since the page’s CSS can’t reach into a tool’s shadow root, a tool would look the same on every page, which means foreign on most of them. CSS custom properties are toolbench’s theme interface, because they inherit across the boundary. mainLog maps toolbench’s properties onto its own design tokens:
tool-host { --tb-bg: var(--bg-1); --tb-fg: var(--tx-0); --tb-muted: var(--tx-1); --tb-faint: var(--tx-2); --tb-border: var(--bd); --tb-surface: var(--bg-2); --tb-accent: var(--ac); --tb-accent-bg: var(--ac-wash-soft); /* ... */}Every tool’s background, text, borders and accent come from the page’s theme, so they follow mainLog’s light and dark modes with no CSS in any tool. The chart colours are mapped the same way, from --tb-s1: light-dark(#2a78d6, #3987e5) through --tb-s6.
Colours are not enough for layout. A tool can give a part of its answer a role, such as answer, which the runtime renders as a data-role attribute and otherwise ignores. The page decides what an answer looks like. A host passes its own stylesheet to defineToolHost as styles, the runtime adopts it into every tool’s shadow root after its own, and the runtime’s rules sit in a cascade layer, @layer toolbench, so an ordinary, unlayered rule from the host wins whatever its specificity. mainLog’s stylesheet has this rule:
[data-role="answer"] .tb-fields { display: grid; grid-template-columns: repeat(auto-fit, minmax(11rem, 1fr)); gap: 0.75rem 2rem; margin: 0;}On mainLog, a fields part with role: "answer" appears as a row of headline values, whichever tool returned it. The styling guide covers what a host may select, and the theme tokens reference lists every property.
Trying it
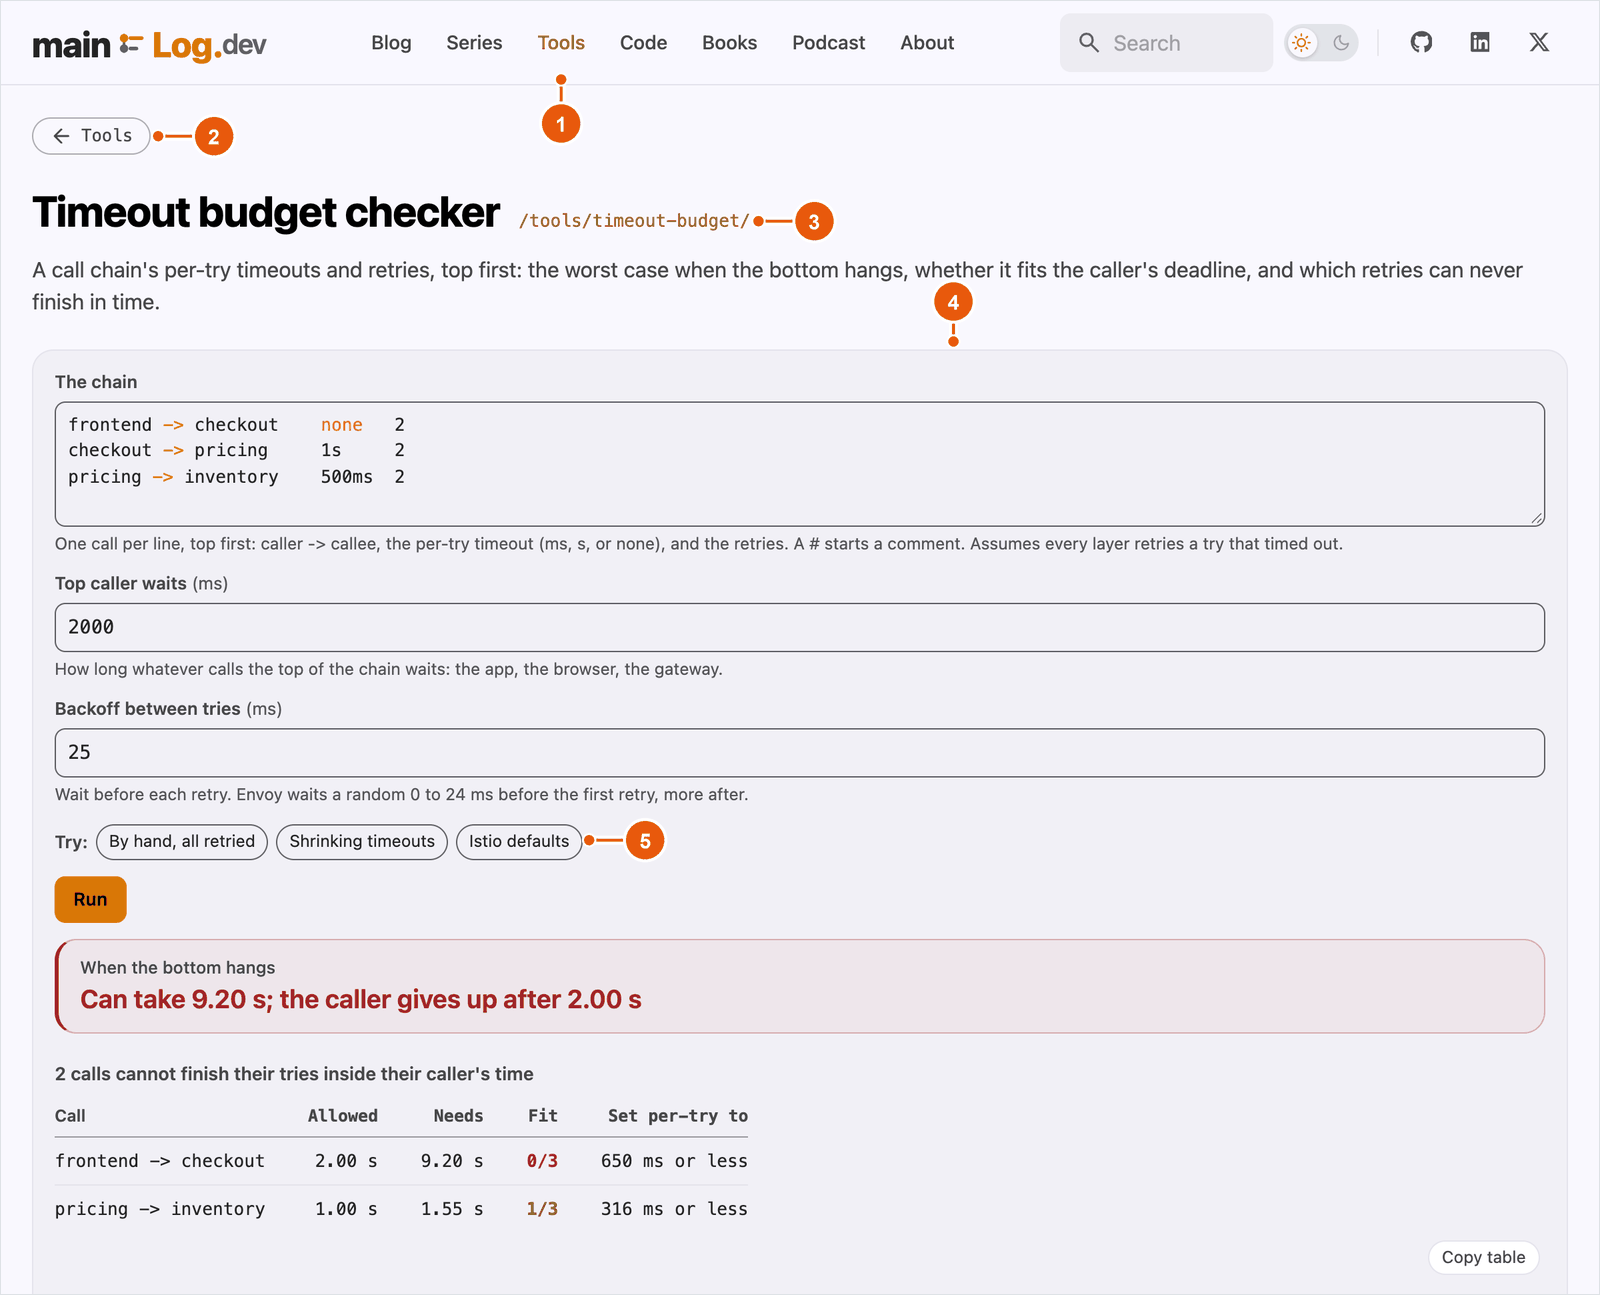
The quickest start is the hello world: npm install, npm test and npm run dev, and the tool from the top of this post runs in a plain page. From there, the getting started guide covers a host’s side, Authoring a tool covers the four files, and the gallery shows every kind of result beside the code that returns it.
On mainLog every tool gets a page of its own, and a post embeds one by writing ::tool{id="stun-decoder"} on a line of its own, which expands to the same <tool-host> with a caption that links the tool’s page. The tools themselves live in a separate repository, toolshed, so they stay standalone functions with their own tests rather than parts of the blog.
I built toolbench for my own tools, and I’d like to know how it holds up for yours. If you build a tool with it, tell me how it went, what was easy and what the contract made awkward, in the comments below or in an issue on GitHub. Happy coding.
Related posts

How many concepts is too many
Framework debates trade concept counts that measure different things. Count what the smallest real program makes its user write, in separate columns and per reader, find the rules the count can't see by misspelling them, and keep an extra concept only when it moves a check earlier or gives users a seam they can see.
The unwritten rulespythonapi-designframeworks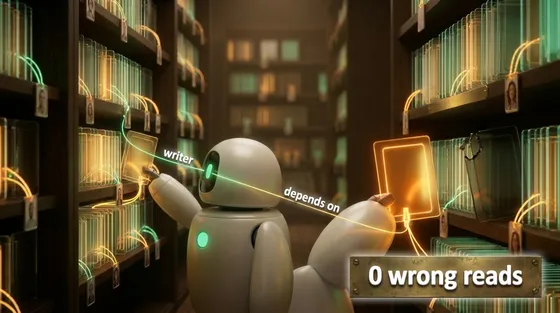
What an agent should remember
Agent memory stores mostly decide what to forget by time: a TTL, or deleting what hasn't been used. In a 90-day scripted scenario, that kept a cancelled booking alive for weeks and stored a restaurant's sentence as the user's preference. Two fields fix both: who wrote the memory, and which event would make it false.
AI & agentic architecturesai-agentsarchitecture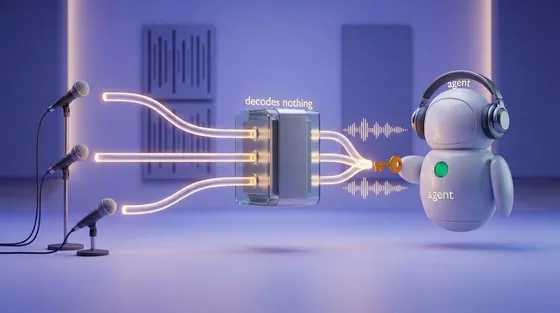
SFU, MCU, and the participant that has to decode
Put an AI agent in a group call and two questions decide the design: does the model hear each person, or one blend, and who has to hold the keys? Both come down to where the agent's audio gets decoded.
AI & agentic architecturesai-agentswebrtcarchitecture
 Software craft
How many concepts is too many
Framework debates trade concept counts that measure different things. Count what the smallest real program makes its user write, in separate columns and per reader, find the rules the count can't see by misspelling them, and keep an extra concept only when it moves a check earlier or gives users a seam they can see.
pythonapi-designOct 2026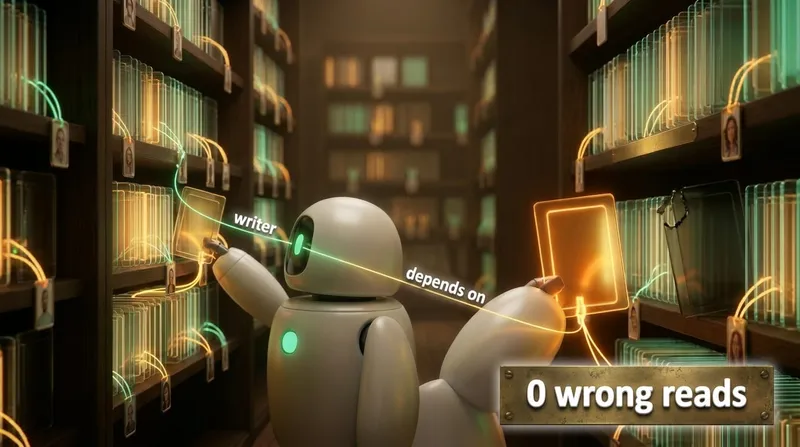 AI
What an agent should remember
Agent memory stores mostly decide what to forget by time: a TTL, or deleting what hasn't been used. In a 90-day scripted scenario, that kept a cancelled booking alive for weeks and stored a restaurant's sentence as the user's preference. Two fields fix both: who wrote the memory, and which event would make it false.
ai-agentsarchitectureOct 2026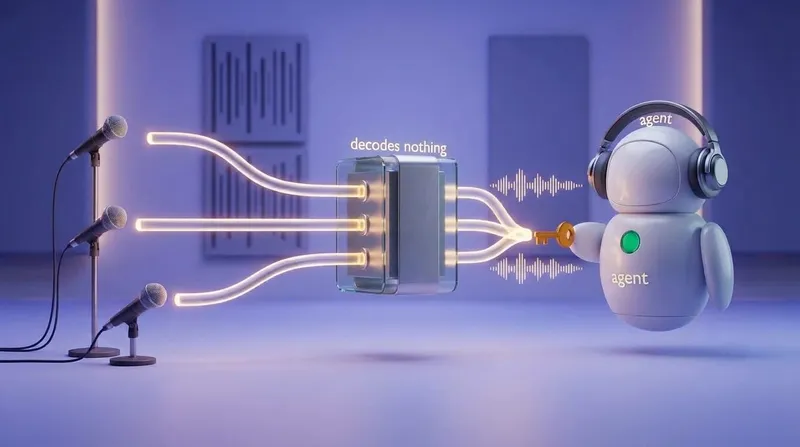 AI
SFU, MCU, and the participant that has to decode
Put an AI agent in a group call and two questions decide the design: does the model hear each person, or one blend, and who has to hold the keys? Both come down to where the agent's audio gets decoded.
ai-agentswebrtcOct 2026
Comments