The receiver talks back
RTCP, round-trip time and bandwidth estimation.
Back to 9:17 AM in Paris. Alice is talking to her assistant, and her laptop is sending her voice as fifty packets a second (post 1), over the path ICE found (post 3), locked with keys only she and the assistant hold (post 4). Five seconds in, 6 of her first 250 packets have gone missing on the way. Post 2 dealt with what the listener does about the gaps. But Alice’s laptop, the sender, has no idea any of it happened.
Here Alice is the one talking and the assistant’s server is the one listening, so the messages we’ll follow go from the server back to Alice. (The reverse direction, the assistant’s answer, works exactly the same way.) We’ll see what the server tells her, how much she can work out from it, including how long a message takes to get there and back without either machine trusting the other’s clock, and why browsers don’t rely on these reports alone.
The short version
- Every few seconds the listener sends a small report back: 60 bytes against 250 voice packets.
- It says how many packets were lost, twice: an exact count, and a share rounded down to steps of 1/256.
- It says how unevenly they arrived, which can warn of trouble before packets start disappearing.
- Two of its numbers let the sender measure the round trip with only its own clock.
- Every few seconds is too slow to steer by, so browsers add feedback for every packet, and the sender backs off by a rule.
A sender that can’t see
Imagine talking into a dark room, and every five seconds someone slips you a note: “I missed six words, and the last few came in bunches.” That’s the whole problem. UDP, which carries the voice, never answers: no acknowledgement, no “slow down”, nothing comes back. If the path to the assistant gets worse, Alice’s laptop will keep sending at the same rate until something tells it otherwise.
That something is RTCP, RTP’s control protocol, and feedback was its job from the start: RFC 3550 calls it “the primary function”, “to provide feedback on the quality of the data distribution” (§6). In a WebRTC call the reports travel on the same port as the voice, and they’re encrypted with the keys from post 4. Both sides send them: Alice’s laptop sends a short one saying what it has sent, and the server sends one saying what arrived. We’ll follow the server’s, coming back to Alice.
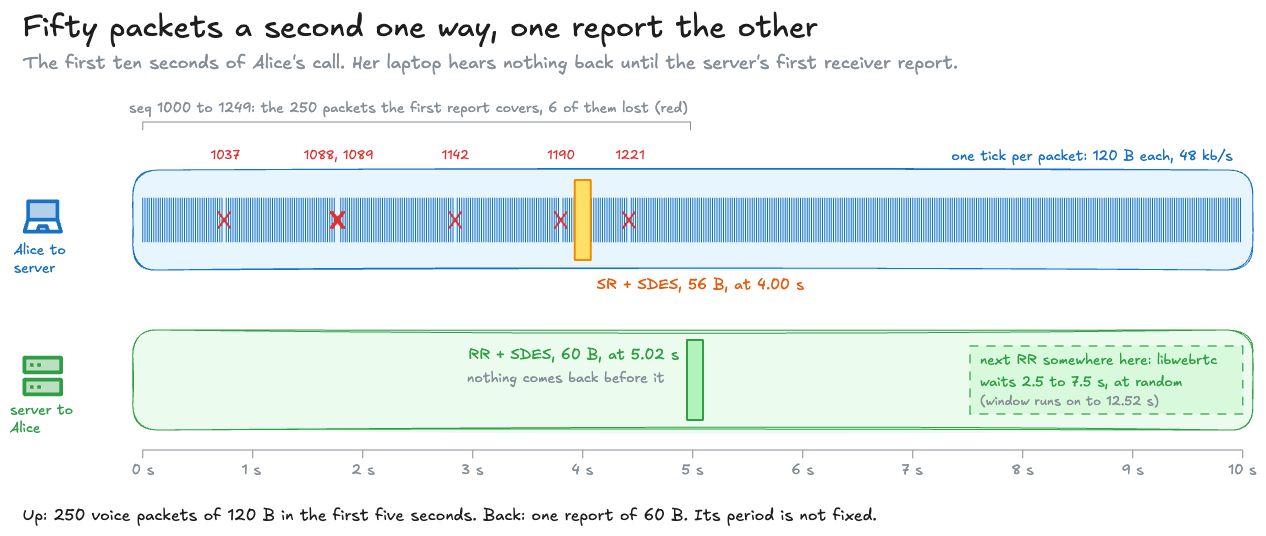
So what does the server actually send back? Let’s follow one run of the demo I wrote for this: a model of the first five seconds of Alice’s call, packet by packet, and the real report bytes the server sends at the end of it. Every number below comes from that run, and the lab further down lets you change it.
One report, byte by byte
There are two kinds of report. A side that’s sending audio sends a sender report (SR): “here’s how much I’ve sent, and the time on my clock”. A side that’s receiving sends a receiver report (RR): what arrived, what didn’t, and how evenly. Here’s the server’s, 5.02 seconds into the call, as rtcp_reports.py builds it:
81 c9 00 07 7a 3b 9c 5dA receiver report. Version 2, one report block, packet type 201, length 7 (32-bit words, minus one), from the server's SSRC 0x7A3B9C5D.1f 2e 3d 4c 06 00 00 06 00 00 04 e1 00 00 00 82 d8 f0 40 00 00 00 fd 70Everything the server knows about Alice's stream. Her SSRC, fraction lost 6, cumulative lost 6, highest sequence 1249, jitter 130, LSR 0xD8F04000, DLSR 0x0000FD70. Read field by field below.81 ca 00 06 7a 3b 9c 5d 01 10 73 2b 72 4e … 00 00Who's speaking. Packet type 202, one item: CNAME, 16 random characters.The middle 24 bytes, the report block, are the whole of what Alice learns:
| Bytes | Field | Value | What it says |
|---|---|---|---|
1f 2e 3d 4c | SSRC | 0x1F2E3D4C | Which stream this is about: Alice’s, from post 1 |
06 | Fraction lost | 6 | 6/256 of packets lost since the last report |
00 00 06 | Cumulative lost | 6 | Packets lost since the call began |
00 00 04 e1 | Highest sequence | 1249 | The newest packet that arrived |
00 00 00 82 | Jitter | 130 | How unevenly packets arrive, in RTP timestamp units |
d8 f0 40 00 | LSR | 0xD8F04000 | Alice’s own timestamp from her last report, sent back to her: half of the round-trip trick below |
00 00 fd 70 | DLSR | 64880 | How long the server held her report before answering, 0.990 s: the other half |
How the demo packs those 24 bytes
def pack(self) -> bytes: lost24 = self.cumulative_lost & 0xFFFFFF # two's complement in 24 bits return struct.pack( "!IIIIII", self.ssrc, (self.fraction_lost << 24) | lost24, self.highest_seq, self.jitter, self.lsr, self.dlsr, )Six 32-bit numbers. The one trick is the second, where an 8-bit share and a 24-bit count share the space. The demo then hands the bytes to aiortc, an independent Python implementation of WebRTC, which reads back the same fields. (The assistant talks too, so a real server would send a sender report with this same block inside it; the demo sends the plain receiver report to keep it short.)
Counting what’s missing
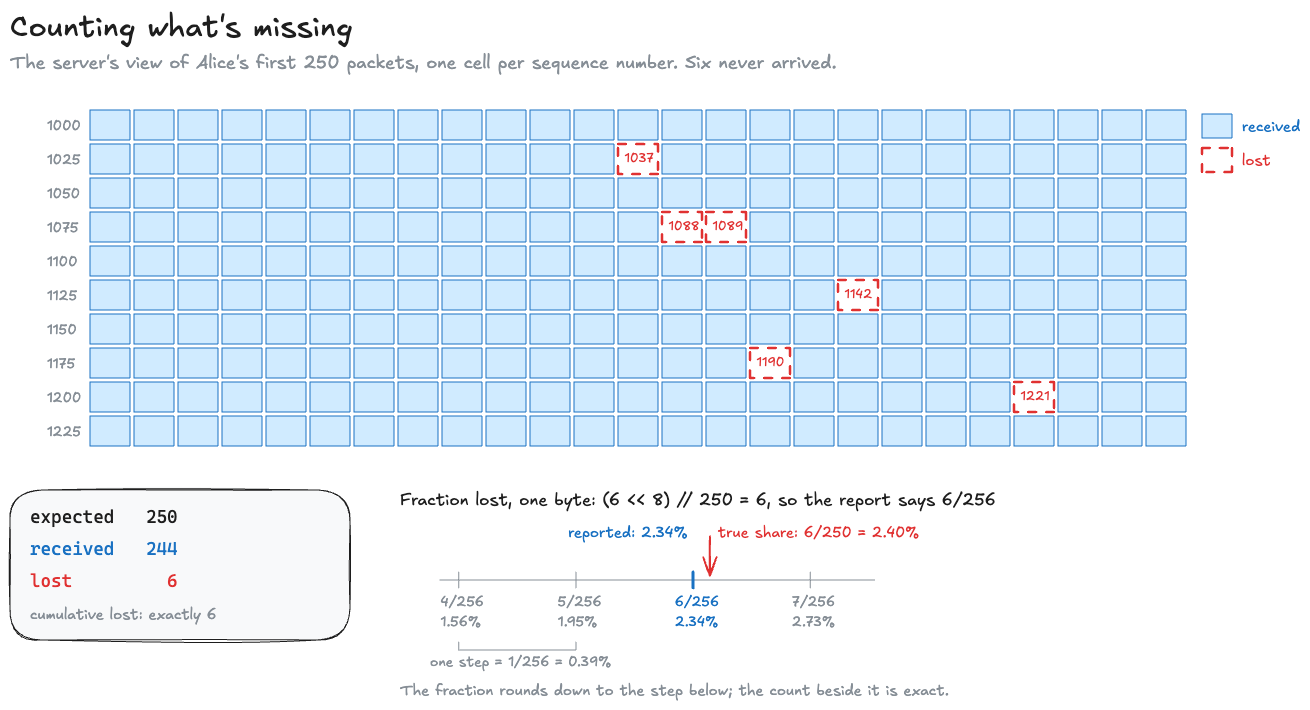
The server has seen packets numbered 1000 to 1249, so it expected 250. It received 244, so the cumulative lost is 6, and that number is exact.
The fraction lost says the same thing as a share, but it has to fit in one byte, so it’s measured in 256ths and rounded down. The demo does it the way RFC 3550’s own sample code does:
expected = highest - FIRST_SEQ + 1 # RFC 3550 A.3: extended_max - base_seq + 1, no wrap in this callreceived = len(arrived)lost = expected - receivedfraction = (lost << 8) // expected # A.3: the first report, so the interval is the whole call so far6 lost out of 250 is 2.40%. In 256ths that’s 6.14, which rounds down to 6, and 6/256 is 2.34%. So the report always says slightly less than the truth, by up to one step of about 0.4%. The exact count is the one to trust, and because it’s a running total, a sender that misses one report loses nothing: the next one still has the full count.
Try it yourself: lose some packets, send the report, and then do it again for the next 250, watching which of the two numbers starts over:
This lab runs a real call in your browser, so it needs JavaScript.
One subtlety ties back to post 2: a packet that arrives late, too late to play, still counts as received. To Alice’s listener it was a dropout; to the report it’s a success.
And over short stretches the share is noisy. The demo’s live call uses aiortc, which reports every 0.5 to 1.5 seconds, far more often than a browser, so each report covers only a few dozen packets. With exactly one packet in every 40 dropped, a steady 2.5% came back as anything from 1.6% to 3.9% from one report to the next, because one packet more or less moves a small share a lot. Remember that: later on, 2% turns out to be a line a sender acts on.
Jitter, the early warning
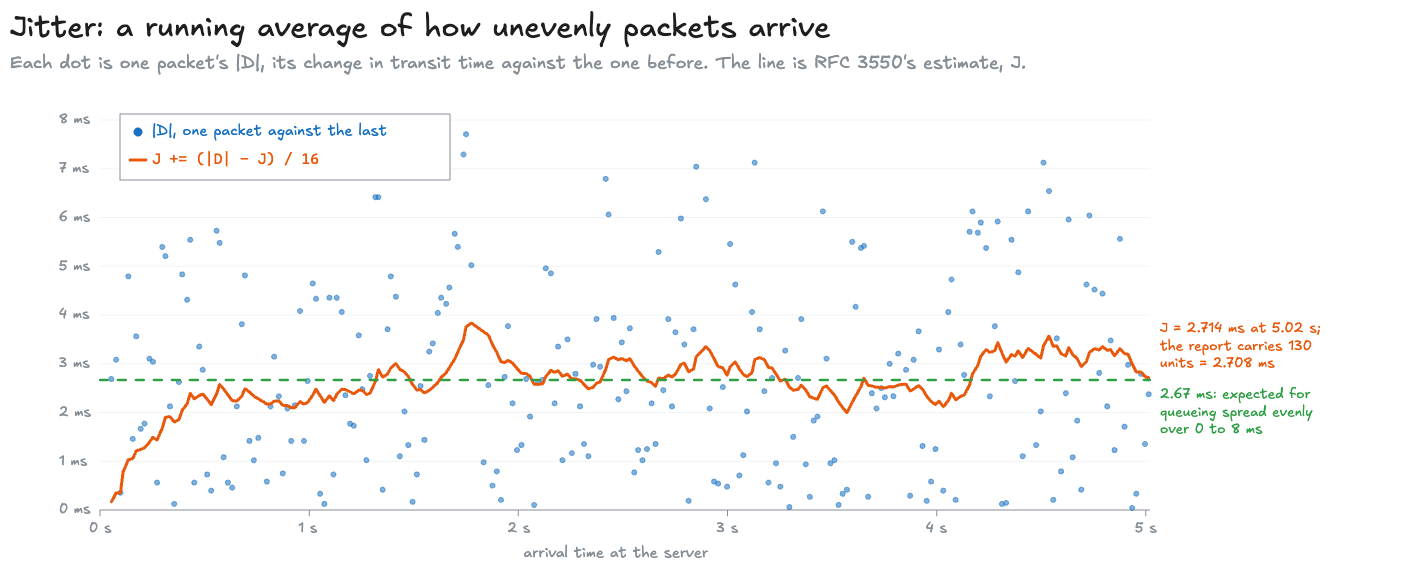
Packets leave Alice’s laptop exactly 20 ms apart. They don’t arrive exactly 20 ms apart, because each one waits a different amount in queues along the way. The jitter field is the listener’s running average of how far off that steady beat the arrivals are.
Why does that matter? Because of what a filling queue looks like. Picture a router whose queue is starting to back up: the packets that left 20 ms apart arrive 21, 23, 26, 30 ms apart, each one having waited a little longer than the one before. Nothing has been lost yet. But the queue is growing, and if the sender keeps going, it will overflow and packets will start to drop. So arrivals spreading out is a warning that comes before the loss. RFC 3550 puts it in one line: “The jitter measure may indicate congestion before it leads to packet loss” (§6.4.4). (Those 21, 23, 26, 30 are made up to show the shape; the demo’s own run, below, is a path that isn’t filling.)
Does the sender steer by this number? Not directly: RFC 3550 calls it “only a snapshot of the jitter at the time of a report”, “not intended to be taken quantitatively”, and browsers watch the growing delays packet by packet instead, as we’ll see. The jitter field is the summary version of the same warning. The number itself moves slowly, by design: each new packet nudges it a sixteenth of the way towards its own lateness, so one odd packet can’t swing it. In the demo each packet waits between 0 and 8 ms at random, and the estimate climbs for about a second and settles:
The formula, and the units
For each pair of packets, the listener compares the gap between their arrival times with the gap between their timestamps, a difference RFC 3550 calls D, and updates: J(i) = J(i-1) + (|D(i-1,i)| - J(i-1))/16 (§6.4.1). In the demo the first steps go 8.06, 16.81, 16.82, 37.39 units. After 244 packets it’s 130 units; Opus timestamps count at 48 kHz (RFC 7587), so that’s 2.708 ms, close to the 8/3 = 2.67 ms you’d expect for delays spread evenly between 0 and 8 ms.
A round trip without synchronised clocks
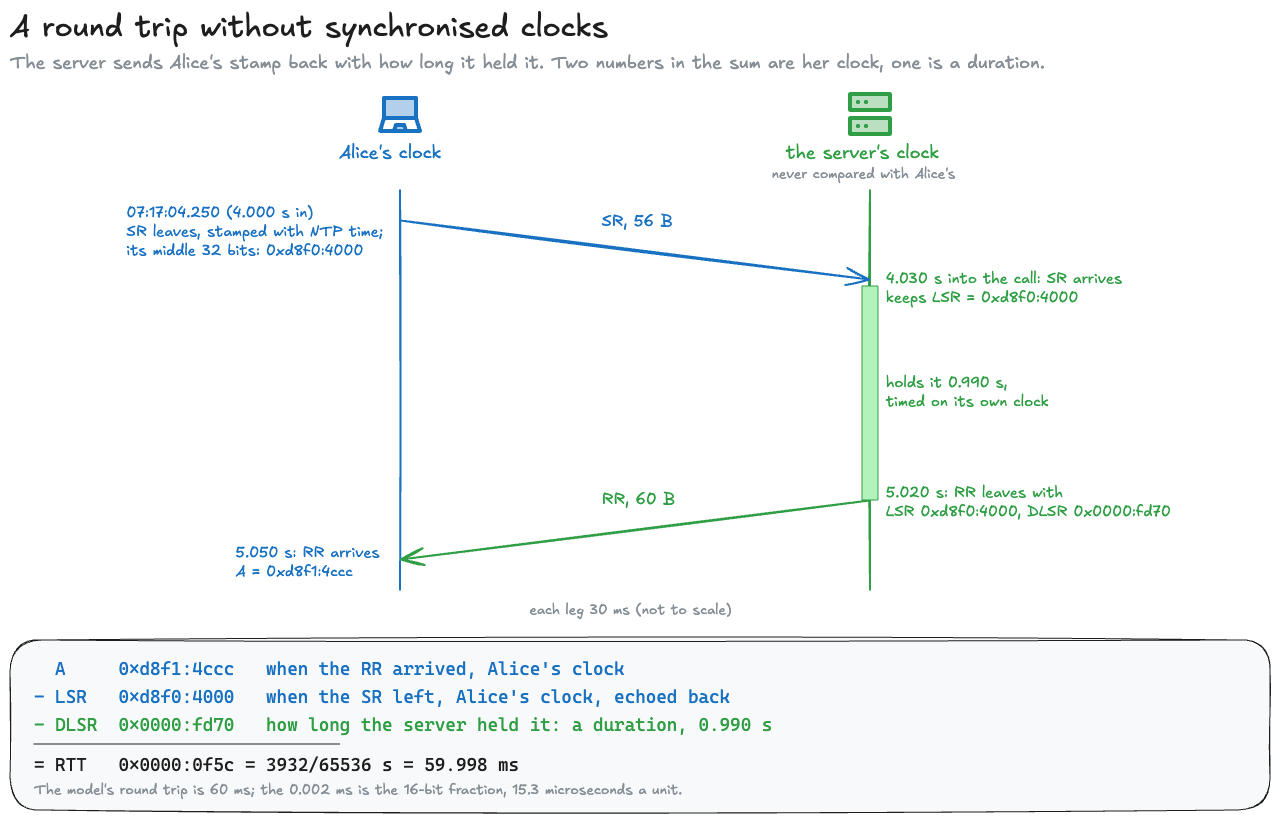
This is the neat part. Alice’s laptop and the assistant’s server each keep their own clock, and even well-kept clocks can disagree by more than the round trip we want to measure. So RTCP measures the round trip without ever comparing the two. In round numbers from the demo:
- Alice sends her own report, a sender report, stamped with her clock: 4.000 s into the call.
- The server keeps that stamp. When it sends its receiver report, it puts two things in it: Alice’s stamp, sent straight back (LSR, “last sender report”), and how long it held it (DLSR, “delay since last sender report”), 0.990 s.
- The report reaches Alice at 5.050 s by her clock. She subtracts: 5.050 - 4.000 - 0.990 = 0.060 s.
5.050 and 4.000 are both readings of Alice’s own clock, and 0.990 is a length of time, which doesn’t care what time the server thinks it is. So what’s left is exactly the time the two messages spent travelling: 60 ms, 30 each way, and neither clock had to be right.
Don’t take my word for it. Set the server’s clock wrong by as much as an hour and send a report:
This lab runs a real call in your browser, so it needs JavaScript.
The same sum as the report carries it, and a bug it caught
On the wire the times are 32-bit fixed-point numbers: 16 bits of seconds and 16 of fraction. Alice’s report left at 07:17:04.250 UTC (9:17 in Paris), and the sum is A - LSR - DLSR = 0xd8f1:4ccc - 0xd8f0:4000 - 0x0000:fd70 = 3932/65536 s = 59.998 ms; the last 0.002 ms is rounding. In the demo it’s one line, rtt = (a - got.lsr - got.dlsr) & 0xFFFFFFFF, and the demo checks it first against RFC 3550’s own worked example, getting the RFC’s 6.125 seconds.
The demo’s live call between two aiortc peers measured 60.7 to 63.9 ms for a 60 ms path. Worked purely from the bytes, though, it read up to about 20 ms high, because aiortc 1.15.0 stamps its sender report with the time of its last audio packet, which can be up to 20 ms old, rather than the moment the report leaves. RFC 3550 says the stamp is the time “when this report was sent”, and this is why.
The inspector reads the two real packets. Both are among its samples, and if you give it the time the report arrived, it does the subtraction:
Every five seconds
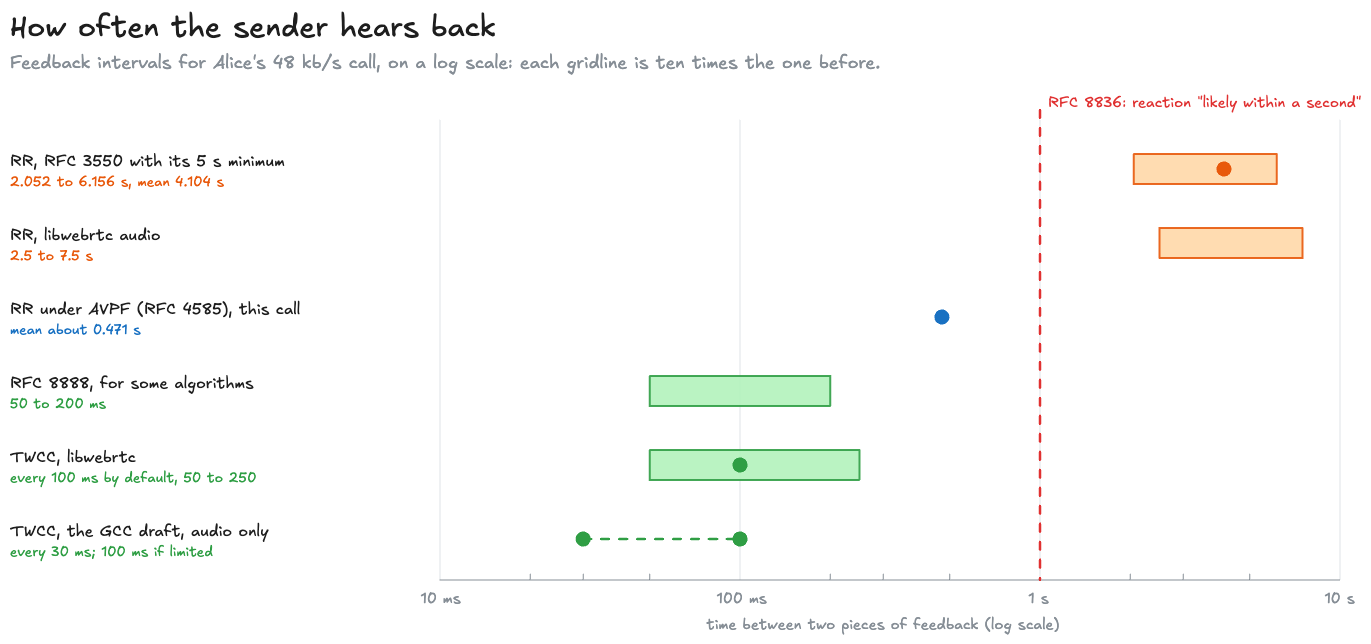
Here’s the catch: these reports don’t come often. RTCP may only use 5% of the call’s bandwidth, and RFC 3550 also sets a floor: “The RECOMMENDED value for a fixed minimum interval is 5 seconds” (§6.2). The 5 seconds is a centre, not a hard minimum: so that a room full of people doesn’t report in lockstep, each wait is picked at random between half and one and a half times it, then shortened slightly, which for Alice’s call puts the reports anywhere from 2 to 6 seconds apart, about 4 on average. Chrome does much the same for audio: a report every 2.5 to 7.5 seconds (libwebrtc, from its code).
Four seconds is a long time in a call: 200 packets go out before Alice hears anything about any of them. The rules for real-time media ask for a reaction “likely within a second” (RFC 8836 §2), and the feedback spec itself admits that “RTCP feedback itself is insufficient for congestion control purposes” (RFC 4585 §7).
Where 2 to 6 seconds comes from
5% of Alice’s 48 kb/s is 2,400 bits a second. With two participants and an average report of 86 bytes, headers included, that would allow a report every 2 × 86 × 8 / 2,400 = 0.573 seconds, but the 5-second floor overrides it. The 5 seconds is then randomised to between half and one and a half times itself and divided by 1.21828, a correction for how the RFC’s timer behaves, which gives 2.05 to 6.16 seconds, 4.1 on average. (A “reduced minimum” of 360 divided by the bandwidth in kb/s only helps above 72 kb/s.) The feedback profile WebRTC uses, AVPF, drops the floor (RFC 4585 §3.2), but Chrome keeps its own 5-second default for audio reports.
Feedback for every packet
So browsers add something faster. With transport-wide congestion control (TWCC), every packet Alice sends carries one extra number (the ordinary sequence number counts within one stream; this one counts every packet on the connection, whatever it carries), and a few times a second the listener sends back a plain list:
packet 1041 arrived at 4.212 spacket 1042 arrived at 4.233 spacket 1043 arrived at 4.255 spacket 1044 never arrivedpacket 1045 arrived at 4.302 sThe shape of the feedback, with made-up times; the real message packs this into a few bytes per packet.
The listener does no maths at all, “keeping the receiver dumb” in the draft’s own words (draft-holmer-rmcat-transport-wide-cc-extensions-01). Alice’s laptop knows when it sent each packet, so from that list it can see each packet’s delay, and whether the delays are growing: the filling queue from the jitter section, spotted in a fraction of a second instead of in four. Chrome sends this list every 100 ms by default (libwebrtc).
Status, and the other feedback messages
TWCC is an expired individual draft, intended as Experimental, never an RFC; Chrome uses it anyway, and an offer from Chrome 154 on macOS asks for it with a=rtcp-fb:111 transport-cc. The standards-track version of the same idea is RFC 8888 (2021). You’ll also see NACK, which asks for specific packets again (RFC 4585 §6.2.1), mostly a video tool for the reasons post 2 gave, and PLI, a video decoder asking for a fresh picture. Neither steers the bitrate.
Backing off
Feedback says what happened; something still has to decide what to send next. In Chrome that’s Google Congestion Control (GCC), written up as an Internet-Draft in 2016 that expired in 2017 and never became an RFC (draft-ietf-rmcat-gcc-02). It has two halves, one for each warning sign we’ve met:
- The delay half watches the per-packet arrival times for the filling-queue pattern, delays growing packet after packet, and backs off before anything is lost.
- The loss half reacts to loss itself, by a rule short enough to read in one go:
| Loss since the last report | What the sender does |
|---|---|
| More than 10% | Cut the sending rate, by half the loss share: 20% loss cuts 10% |
| 2% to 10% | Leave it alone |
| Less than 2% | Raise it by 5% |
The middle band is deliberate. If Alice is the one overloading the path, the loss “will soon increase if the sender does not adjust”, so it’ll cross 10% anyway; loss that stays put is “probably not related to self-inflicted congestion” (§6). The demo’s simulation runs just this loss half, once per report, which is what the draft says a sender should do when all it gets is receiver reports (§7):
def rule(m: Model, rate: float, p: float) -> tuple[float, str]: """draft-ietf-rmcat-gcc-02 section 6, then held inside what the codec can do.""" if p > 0.10: new, why = rate * (1 - 0.5 * p), "decrease" elif p >= 0.02: new, why = rate, "hold" else: new, why = rate * 1.05, "increase" if new >= m.wire_max: return m.wire_max, "ceiling" if why == "increase" else why if new <= m.wire_min: return m.wire_min, "floor" return new, whyThe first half is the three bands; the last four lines keep the result inside what Opus can do. To be clear about what it is: a simulation of the draft’s rule on a path with no queue, so loss is simply whatever Alice sends above the path’s capacity. It isn’t Chrome’s code, which ramps up by time rather than per report. It’s the rule as written, so we can see what the report interval does to it.
Squeeze Alice’s path from 100 kb/s down to 30 kb/s for half a minute, from 30 s to 60 s, and compare reports every 5 seconds with reports every second:
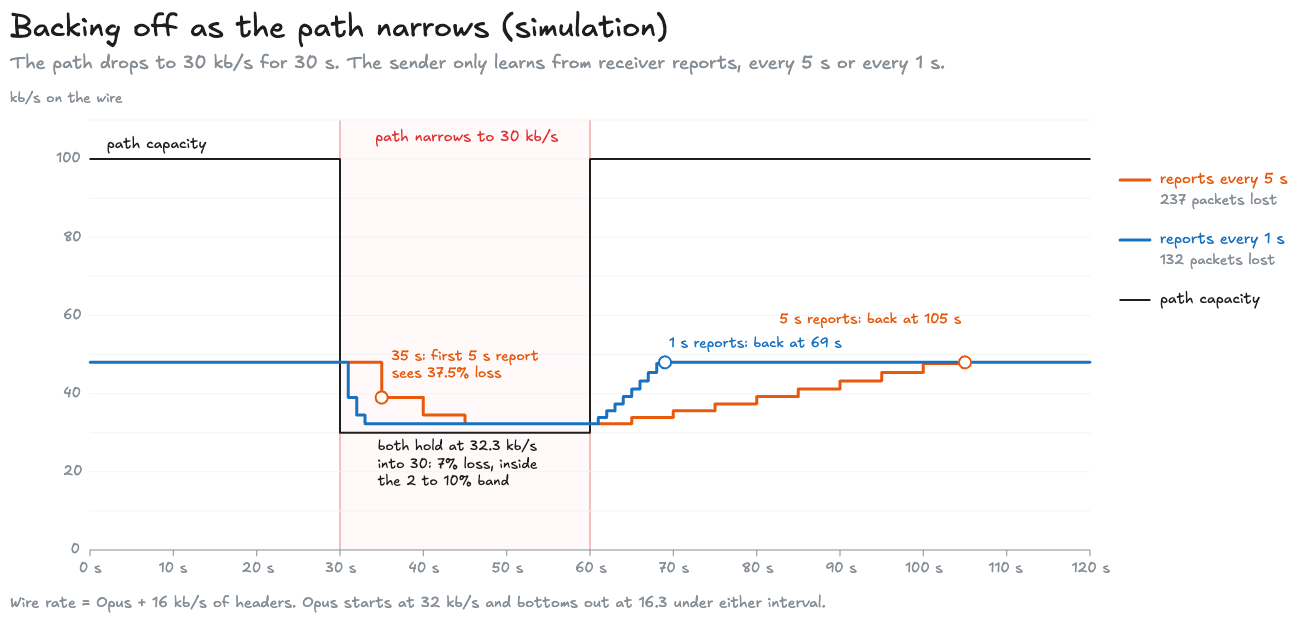
| Measure | Reports every 5 s | Reports every 1 s |
|---|---|---|
| First reaction | At 35 s, to 37.5% loss | At 31 s, to 37.5% loss |
| Settled | 15 s after the squeeze began | 3 s after |
| Packets lost | 237 | 132 |
| Back to full rate after the squeeze ends at 60 s | 45 s later, at 105 s | 9 s later, at 69 s |
From backoff_sim.py. Opus between 6 and 32 kb/s, plus 16 kb/s of headers.
Faster feedback lost 44% fewer packets with the same rule. Watch the 5-second run’s steps: 48 kb/s on the wire, cut to 39, then 34.5, then 32.3, each cut smaller because each report sees less loss. And both runs get stuck in the same place: 32.3 kb/s into a 30 kb/s path, losing 7%, for as long as the squeeze lasts. 7% is inside the “leave it alone” band, so a loss-only rule never moves again. That’s exactly the gap the delay half fills, and why browsers want per-packet feedback: it sees the queue grow and backs off before the 7% ever happens.
The other trap is loss that isn’t Alice’s fault at all, the kind a bad radio link causes. Give the path plenty of capacity but drop 15% of packets at random from 40 s: the rule cuts, and keeps cutting, because sending less doesn’t fix the radio. With reports every second, Opus is pushed down to its 6 kb/s floor by 51 s, and 200 packets are lost either way. Backing off can’t fix that kind of loss; it only makes every packet that does arrive sound worse.
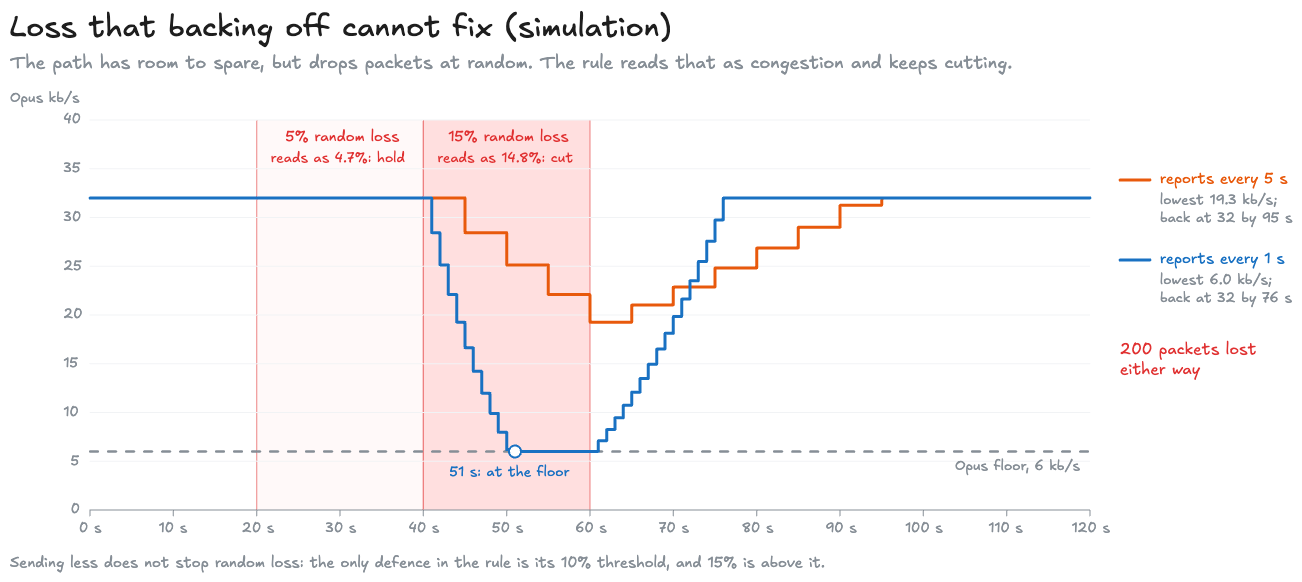
The lab runs the same simulation. Pick a network, then switch the report between every 5, 2 and 1 seconds, and watch the bold line and the packets lost. In the squeeze, faster reports cut the losses from 237 to 132. On the radio link, every interval loses 200, and faster reports only push Opus further down.
This lab runs a real call in your browser, so it needs JavaScript.
What Opus does with less
Opus can run anywhere “from 6 kbit/s to 510 kbit/s”, and change its rate at any moment (RFC 7587 §3.1), so the sender can follow the estimate packet by packet. The catch is the headers: at 50 packets a second, IP, UDP and RTP cost 16 kb/s whatever Opus does (the bitrate post worked through it). At the bottom of the squeeze, 32.3 kb/s on the wire is only 16.3 kb/s of sound: a third less wire cost half the sound. Sending 60 ms per packet instead of 20 cuts the headers to a third, but makes every lost packet a gap three times as long (RFC 7587 §5).
What to watch in a real call
All of this is visible in a browser. getStats() reports the listener’s view as remote-inbound-rtp, and Chrome shows the same numbers at chrome://webrtc-internals. Start a call in this tab and watch your own browser’s reports come in, a few seconds apart:
This lab runs a real call in your browser, so it needs JavaScript.
What each number means:
| Counter | What it tells you |
|---|---|
roundTripTime | The round trip from LSR and DLSR, in seconds; it “MUST NOT exist until a RTCP Receiver Report is received with a DLSR value other than 0” (webrtc-stats) |
fractionLost | The 8-bit fraction from the last report, as a fraction: expect steps of 1/256 |
packetsLost | The cumulative count, the exact one |
jitter | The receiver’s jitter estimate, converted to seconds |
The demo
The three scripts are in receiver-talks-back/: rtcp_reports.py builds and reads the two reports above, backoff_sim.py runs the simulation, and capture_call.py makes a real call between two aiortc peers with packets dropped on purpose and checks that every report’s count matches what was dropped.
cd mainlog-code/receiver-talks-backpython3 rtcp_reports.py # no install neededpython3 backoff_sim.py # no install needed; --csv squeeze for a row per secondpython3 -m venv .venv && .venv/bin/pip install -r requirements.txt.venv/bin/python capture_call.py # needs aiortc, about ten secondsIts CI checks the report bytes, the arithmetic and the simulation’s numbers, and runs the live call to check the counts and that the round trip stays near 60 ms.
So Alice’s laptop now hears back: a little, every few seconds, and with per-packet feedback, many times a second. It has a way to back off, and we’ve seen where that way falls short. Next, the server stops being the only other end: what changes when Alice is on a call with Bob and Carol, and where the server sits.
Related posts
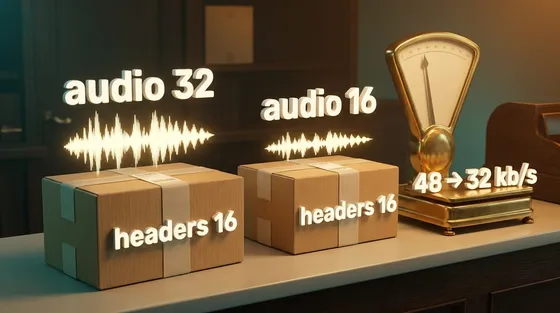
Half the bitrate, two thirds the traffic
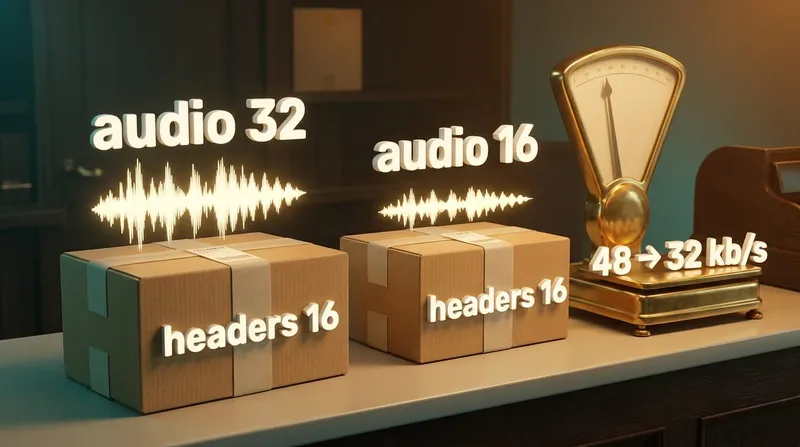
Halving an audio bitrate from 32 to 16 kb/s took traffic from 48 to 32, because every packet's headers stay the same size. Packet rate is the other control.
Down to the wireaudionetworkingperformance
SFU, MCU, and the participant that has to decode
Put an AI agent in a group call and two questions decide the design: does the model hear each person, or one blend, and who has to hold the keys? Both come down to where the agent's audio gets decoded.
AI & agentic architecturesai-agentswebrtcarchitecture
What a service mesh costs
Your shop now runs 14 services in three languages, and security wants every call between them encrypted and identified. A mesh does that without touching the code, for about a fifth of a millisecond per hop and a tenth of a core per proxy per 1,000 requests a second, measured here with real Envoy. It also brings retry and queue defaults nobody chose. Over plain HTTP they retry less than most people expect; over gRPC, or after one common edit, a failing service gets 27 calls for one checkout.
Down to the wireinfrastructuremicroservicesnetworking
 Networking & media
Half the bitrate, two thirds the traffic
Halving an audio bitrate from 32 to 16 kb/s took traffic from 48 to 32, because every packet's headers stay the same size. Packet rate is the other control.
audionetworkingAug 2026 AI
SFU, MCU, and the participant that has to decode
Put an AI agent in a group call and two questions decide the design: does the model hear each person, or one blend, and who has to hold the keys? Both come down to where the agent's audio gets decoded.
ai-agentswebrtcOct 2026 Systems
What a service mesh costs
Your shop now runs 14 services in three languages, and security wants every call between them encrypted and identified. A mesh does that without touching the code, for about a fifth of a millisecond per hop and a tenth of a core per proxy per 1,000 requests a second, measured here with real Envoy. It also brings retry and queue defaults nobody chose. Over plain HTTP they retry less than most people expect; over gRPC, or after one common edit, a failing service gets 27 calls for one checkout.
infrastructuremicroservicesOct 2026
Comments